GRIB笔记:使用eccodes-python加载垂直剖面图数据
上一篇文章《GRIB笔记:使用cfgrib加载垂直剖面图数据》 介绍使用 nwpc-oper/nwpc-data 封装的 cfgrib 接口加载垂直剖面图数据。 但笔者尚未找到使用 cfgrib 加载全部等压面层数据的方法。
本文介绍如何使用 nwpc-oper/nwpc-data 封装的 eccodes-python 接口加载绘制垂直剖面图需要的数据。
准备数据
使用 GRAPES GFS 模式的预报数据绘制温度场的垂直剖面图。 对于 GRAPES 模式来说,某个预报时效所有层次的变量都保存到同一个文件中,所以从单个文件中就能获取绘制剖面图需要的所有数据。
使用 nwpc-oper/nwpc-data 提供的工具获取 CMA 二级存储上的文件路径。
from nwpc_data.data_finder import find_local_file
file_path = find_local_file(
    "grapes_gfs_gmf/grib2/orig",
    start_time="2020031800",
    forecast_time="105h",
)
print(file_path)
/sstorage1/COMMONDATA/OPER/NWPC/GRAPES_GFS_GMF/Prod-grib/2020031721/ORIG/gmf.gra.2020031800105.grb2
加载等压面层数据
nwpc-oper/nwpc-data 提供封装 eccodes-python 的接口,从本地文件中获取要素场并返回 xarray.DataArray 对象。
具体实现方法请参考《从ecCodes的GRIB2消息构建xarray对象》。
from nwpc_data.grib.eccodes import load_field_from_file

short_name = "t"
level_type = "pl"

field = load_field_from_file(
    file_path=file_path,
    parameter=short_name,
    level_type=level_type,
    level_dim="isobaricInhPa",
)
field
Filtering: 100%|██████████| 837/837 [00:00<00:00, 1877.44it/s]
Creating DataArrays: 100%|██████████| 40/40 [00:12<00:00, 3.13it/s]
concat DataArrays...
<xarray.DataArray 't' (isobaricInhPa: 40, latitude: 720, longitude: 1440)>
array([[[245.73582031, 245.72582031, 245.74582031, ..., 245.73582031,
...skip...
236.2610625 , 236.2610625 ]]])
Coordinates:
step timedelta64[ns] 4 days 09:00:00
time datetime64[ns] 2020-03-18
* latitude (latitude) float64 89.88 89.62 89.38 ... -89.38 -89.62 -89.88
* longitude (longitude) float64 0.0 0.25 0.5 0.75 ... 359.2 359.5 359.8
* isobaricInhPa (isobaricInhPa) float64 1e+03 975.0 950.0 ... 0.5 0.2 0.1
Attributes:
GRIB_edition: 2
...skip...
long_name: Temperature
units: K
level_type 是层次类型,pl 表示等压面层,在函数内部被解析为层次类型的过滤条件 { "typeOfFirstFixedSurface": 100 }。
level_dim 参数用于指定层次维度的名称,当其值为 isobaricInhPa 时,会将等压面层次的单位转换为 hPa。
返回的结果与 cfgrib 类似,但加载了所有层次,共计 40 个要素场, isobaricInhPa 维度是浮点数类型。
另外,与 cfgrib 不同,上述函数执行过程中就会解码数组,从进度条可以看到,串行加载 40 个要素场需要 12 秒,效率不高。
纬度剖面
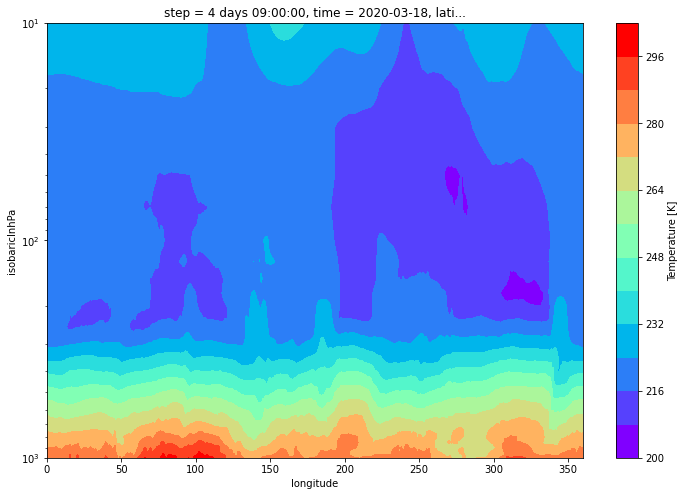
下面获取北纬 40 度的垂直剖面数据,使用 nearest 方法获取最近邻数据。
data = field.sel(isobaricInhPa=slice(1000, 10)).sel(latitude=40, method="nearest")
data
<xarray.DataArray 't' (isobaricInhPa: 30, longitude: 1440)>
array([[285.24582031, 284.34582031, 285.29582031, ..., 286.30582031,
285.79582031, 285.48582031],
...skip...
[226.7138125 , 226.7538125 , 226.7748125 , ..., 226.6458125 ,
226.6628125 , 226.6878125 ]])
Coordinates:
step timedelta64[ns] 4 days 09:00:00
time datetime64[ns] 2020-03-18
latitude float64 40.12
* longitude (longitude) float64 0.0 0.25 0.5 0.75 ... 359.2 359.5 359.8
* isobaricInhPa (isobaricInhPa) float64 1e+03 975.0 950.0 ... 30.0 20.0 10.0
Attributes:
GRIB_edition: 2
...skip...
long_name: Temperature
units: K
绘制剖面图
plot_color_map = "rainbow"
plot_levels = 15

data.plot.contourf(
    size=8,
    cmap=plot_color_map,
    yincrease=False,
    yscale="log",
    levels=plot_levels,
)
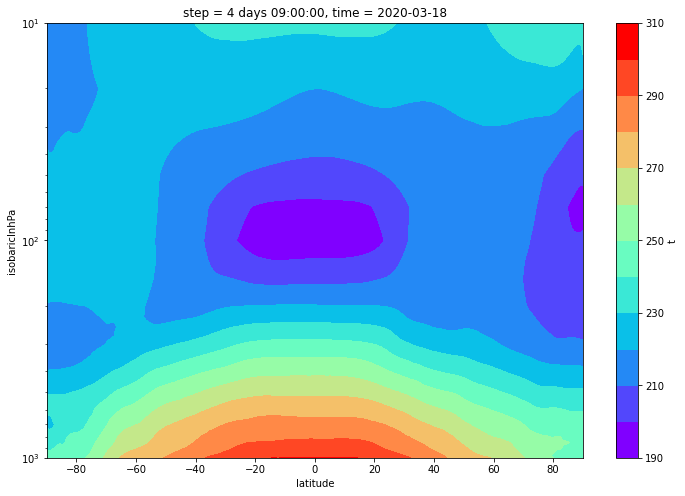
纬向平均
求纬向平均
data = field.sel(isobaricInhPa=slice(1000, 10)).mean(dim="longitude")
data
<xarray.DataArray 't' (isobaricInhPa: 30, latitude: 720)>
array([[245.58832726, 245.59031337, 245.58709115, ..., 243.30982726,
243.2180217 , 243.01900087],
[244.76310807, 244.70698307, 244.65993446, ..., 242.1994553 ,
242.10803168, 241.90964974],
[244.60264844, 244.61296094, 244.58246094, ..., 241.0617526 ,
240.97050955, 240.77314844],
...,
[210.05645486, 210.44189792, 210.44146875, ..., 219.56930694,
219.58511875, 219.57981319],
[219.71511667, 220.03829444, 220.11637708, ..., 219.54368264,
219.53703681, 219.5403125 ],
[236.6471 , 234.70643681, 233.65494444, ..., 219.78305 ,
219.78226806, 219.77923056]])
Coordinates:
step timedelta64[ns] 4 days 09:00:00
time datetime64[ns] 2020-03-18
* latitude (latitude) float64 89.88 89.62 89.38 ... -89.38 -89.62 -89.88
* isobaricInhPa (isobaricInhPa) float64 1e+03 975.0 950.0 ... 30.0 20.0 10.0
绘制 zonal mean 图
data.plot.contourf(
    size=8,
    cmap=plot_color_map,
    yincrease=False,
    yscale="log",
    levels=plot_levels,
)
问题
串行加载多层次要素场效率太低。 据说信息中心检索 EC 高分 53 个预报时效的站点序列数据只需要 1.96 秒,比笔者开发的函数快了一个数量级。 如果计算月平均或年平均,加载数据的耗时将变得无法接受。
后续笔者将研究并行读取 GRIB 2 文件的方法,期望能显著提高数据加载效率。
