WeatherBench:创建气候态和持续性预报
本文来自 weatherbench 项目源码:
https://github.com/pangeo-data/WeatherBench/blob/master/notebooks/1-climatology-persistence.ipynb
在本文中,我们将创建最基本的基准:
- 气候态,climatology
- 持续性预报,persistence forecast
我们将在 500hPa 位势高度,850hPa 温度,降水和 2m 温度下进行此操作
import numpy as np
import xarray as xr
import matplotlib.pyplot as plt
import seaborn as sns
sns.set_style('darkgrid')
sns.set_context('notebook')
加载数据
首选,我们需要指定目录并加载数据
res = '5.625'
data_dir = f'/g11/wangdp/data/weather-bench/{res}deg'
baseline_dir = '/g11/wangdp/data/weather-bench/baselines-wangdp'
列出数据目录下的所有子目录
10m_u_component_of_wind  geopotential_500     toa_incident_solar_radiation
10m_v_component_of_wind  potential_vorticity  total_cloud_cover
2m_temperature		 relative_humidity    total_precipitation
all_5.625deg.zip	 specific_humidity    u_component_of_wind
constants		 temperature	      v_component_of_wind
geopotential		 temperature_850      vorticity
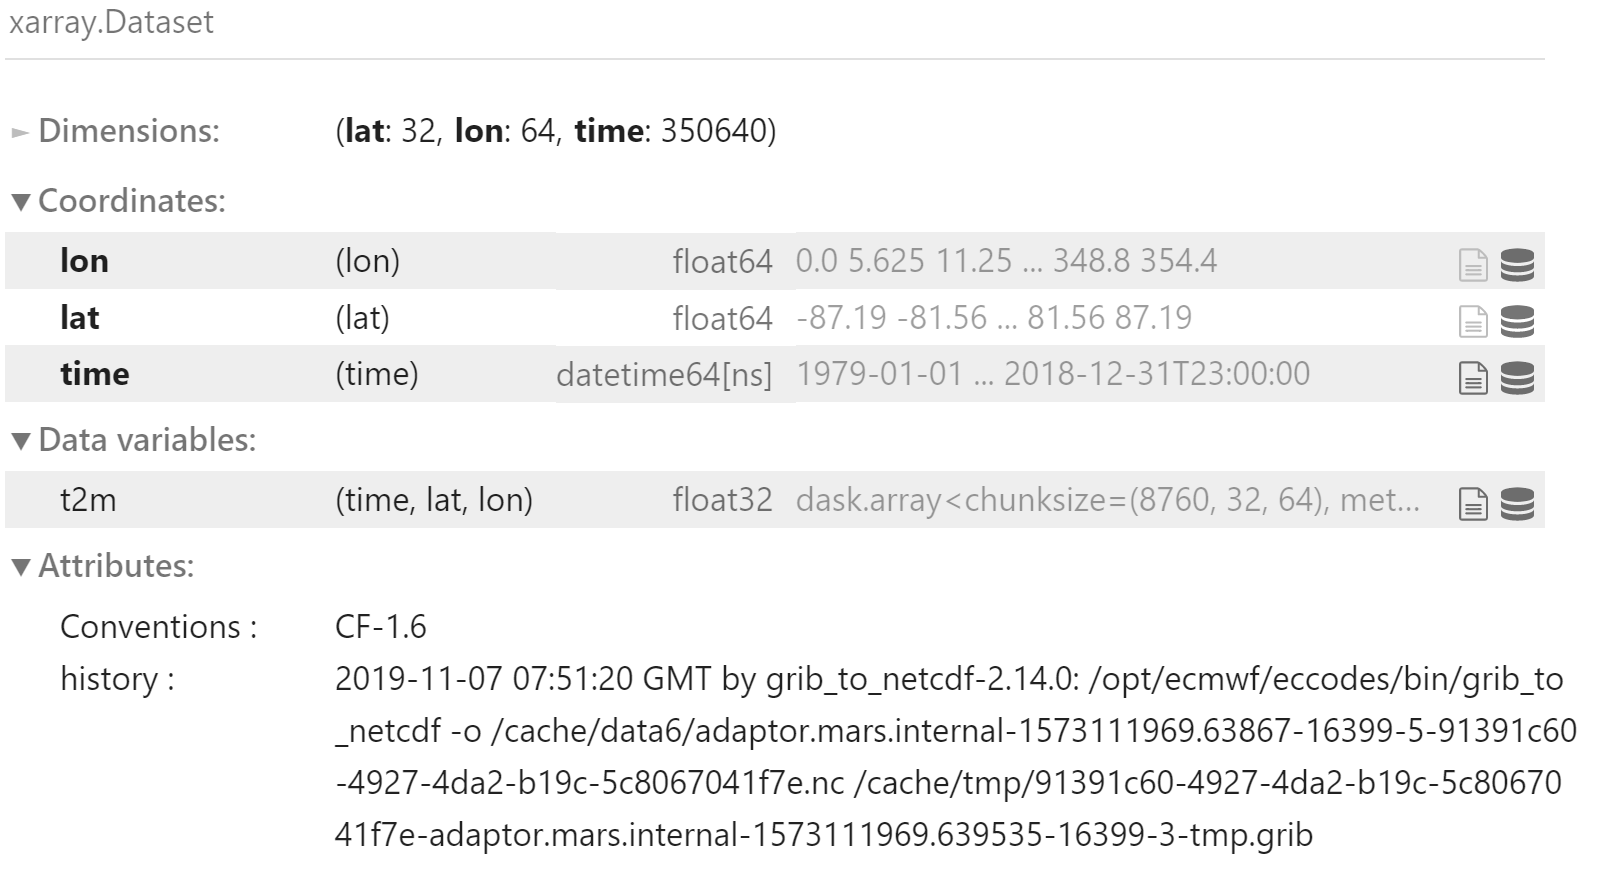
加载全部 2m 温度数据
xr.open_mfdataset(
    f'{data_dir}/2m_temperature/*.nc',
    combine='by_coords'
)
加载相关变量
注意:需要通过计算得到 6 小时累计降水
z500 = xr.open_mfdataset(
    f'{data_dir}/geopotential_500/*.nc',
    combine='by_coords').z
t850 = xr.open_mfdataset(
    f'{data_dir}/temperature_850/*.nc',
    combine='by_coords'
).t.drop('level')

tp = xr.open_mfdataset(
    f'{data_dir}/total_precipitation/*.nc',
    combine='by_coords'
).tp.rolling(time=6).sum()
tp.name = 'tp'

t2m = xr.open_mfdataset(
    f'{data_dir}/2m_temperature/*.nc',
    combine='by_coords'
).t2m
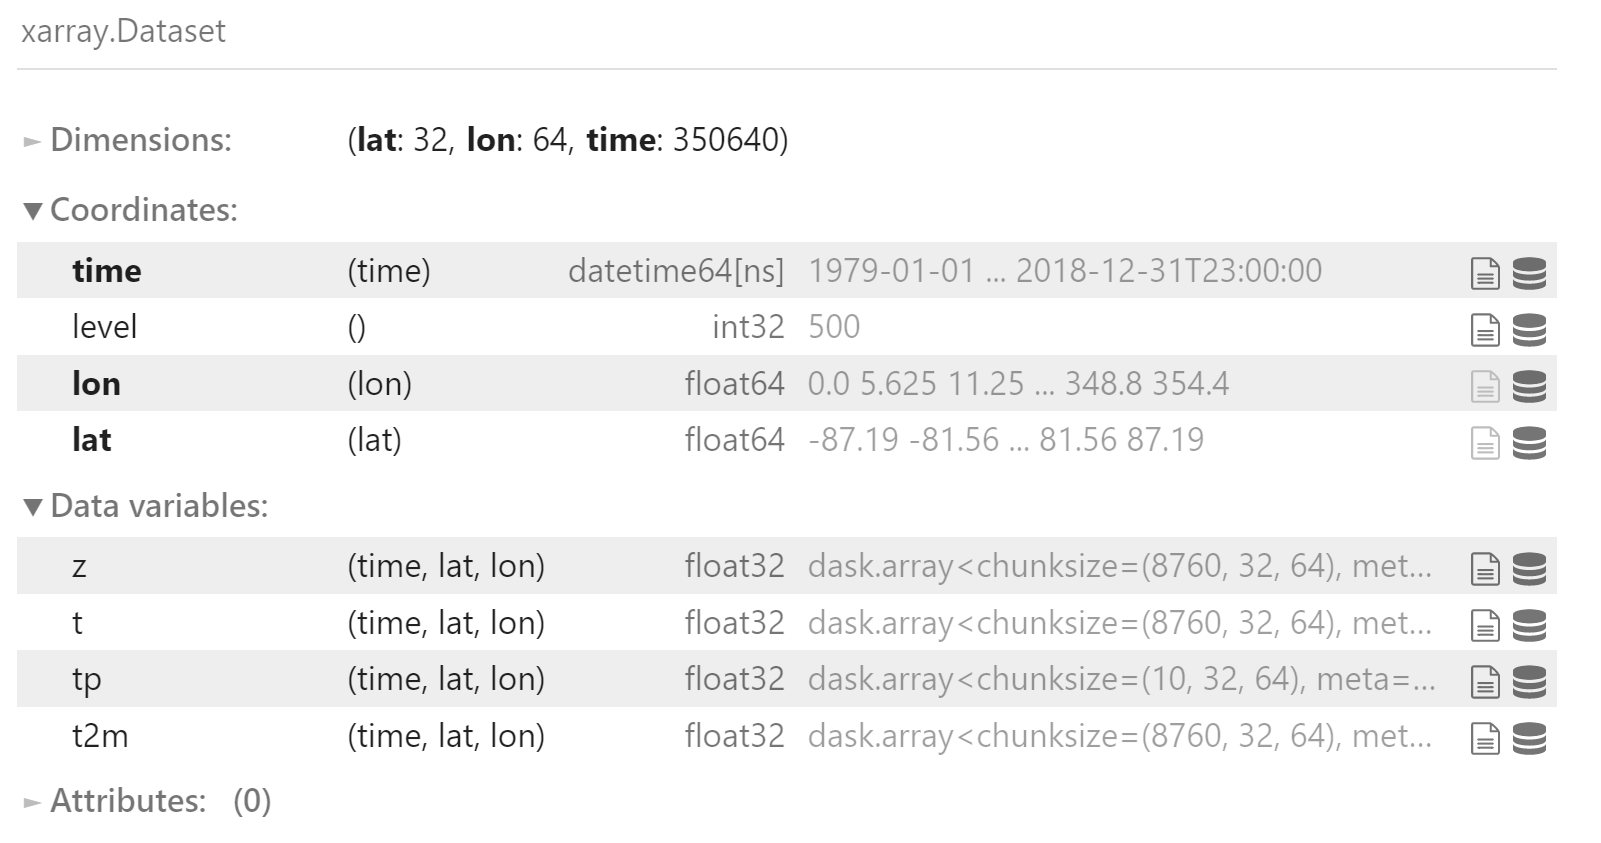
构建完整数据集
data = xr.merge([
    z500,
    t850,
    tp,
    t2m
])
data
加载验证集:2017 年和 2018 年
def load_test_data(
    path,
    var,
    years=slice('2017', '2018')
):
    ds = xr.open_mfdataset(
        f'{path}/*.nc',
        combine='by_coords'
    )[var]
    if var in ['z', 't']:
        try:
            ds = ds.sel(
                level=500 if var == 'z' else 850
            ).drop('level')
        except ValueError:
            ds = ds.drop('level')
    return ds.sel(time=years)
z500_valid = load_test_data(
    f'{data_dir}/geopotential_500', 'z'
)

t850_valid = load_test_data(
    f'{data_dir}/temperature_850', 't'
)

tp_valid = load_test_data(
    f'{data_dir}/total_precipitation', 'tp'
).rolling(time=6).sum()
tp_valid.name = 'tp'

t2m_valid = load_test_data(
    f'{data_dir}/2m_temperature', 't2m'
)
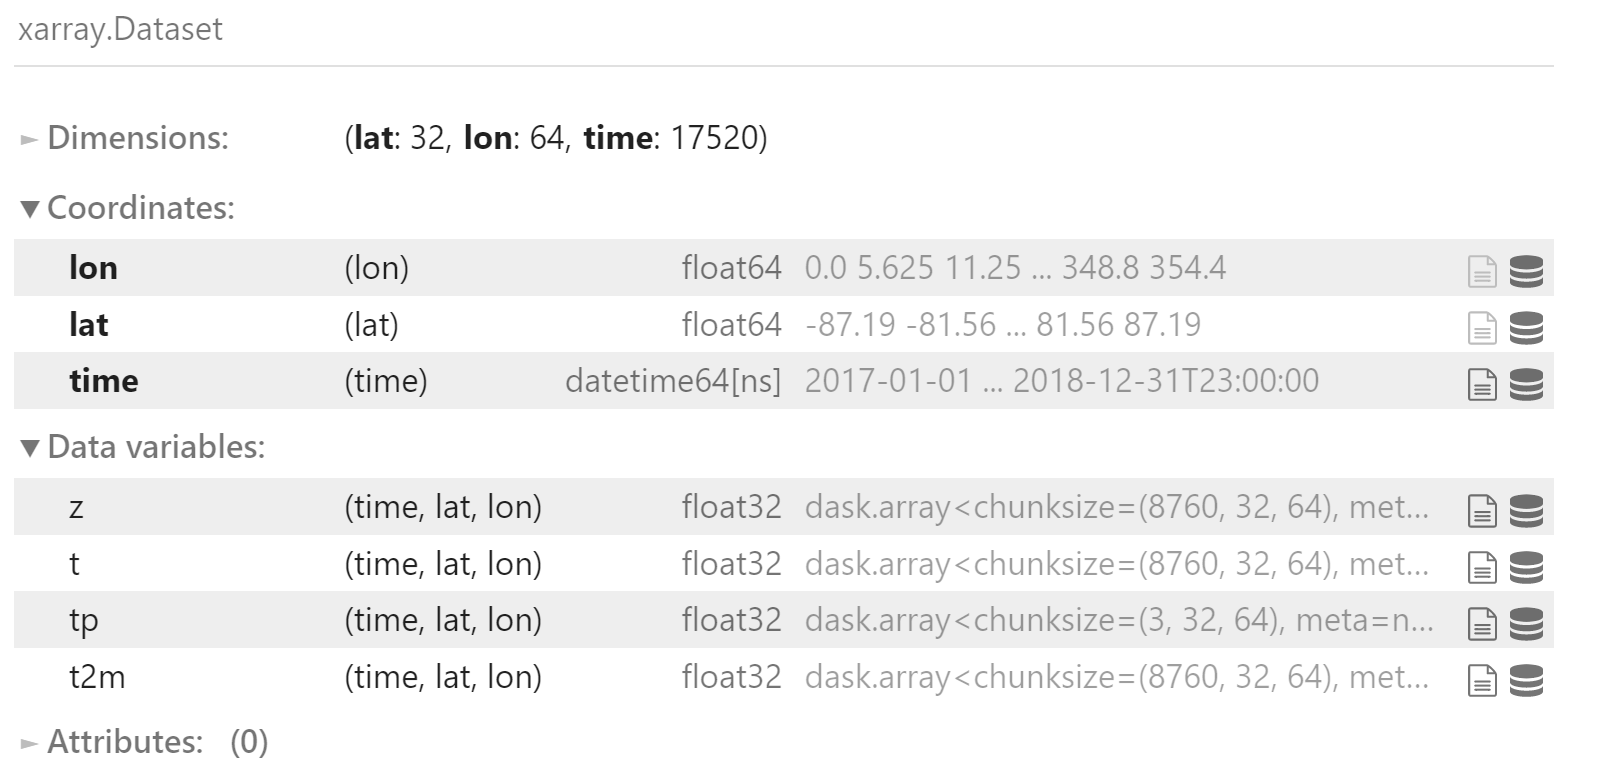
合并验证集
valid_data = xr.merge([
    z500_valid,
    t850_valid,
    tp_valid,
    t2m_valid
])
valid_data
持续性预报
Persistence Forecast
持续性可以简单理解为:明天的天气就是今天的天气
def create_persistence_forecast(ds, lead_time_h):
    assert lead_time_h > 0, 'Lead time must be greater than 0'
    ds_fc = ds.isel(
        time=slice(0, -lead_time_h)
    )
    return ds_fc
创建 5 天逐 6 小时数组
lead_times = xr.DataArray(
    np.arange(6, 126, 6),
    dims=['lead_time'],
    coords={'lead_time': np.arange(6, 126, 6)},
    name='lead_time'
)
lead_times

为验证集生成持续性预报
persistence = []
for l in lead_times:
    persistence.append(
        create_persistence_forecast(valid_data, int(l))
    )
persistence = xr.concat(
    persistence,
    dim=lead_times
)
persistence
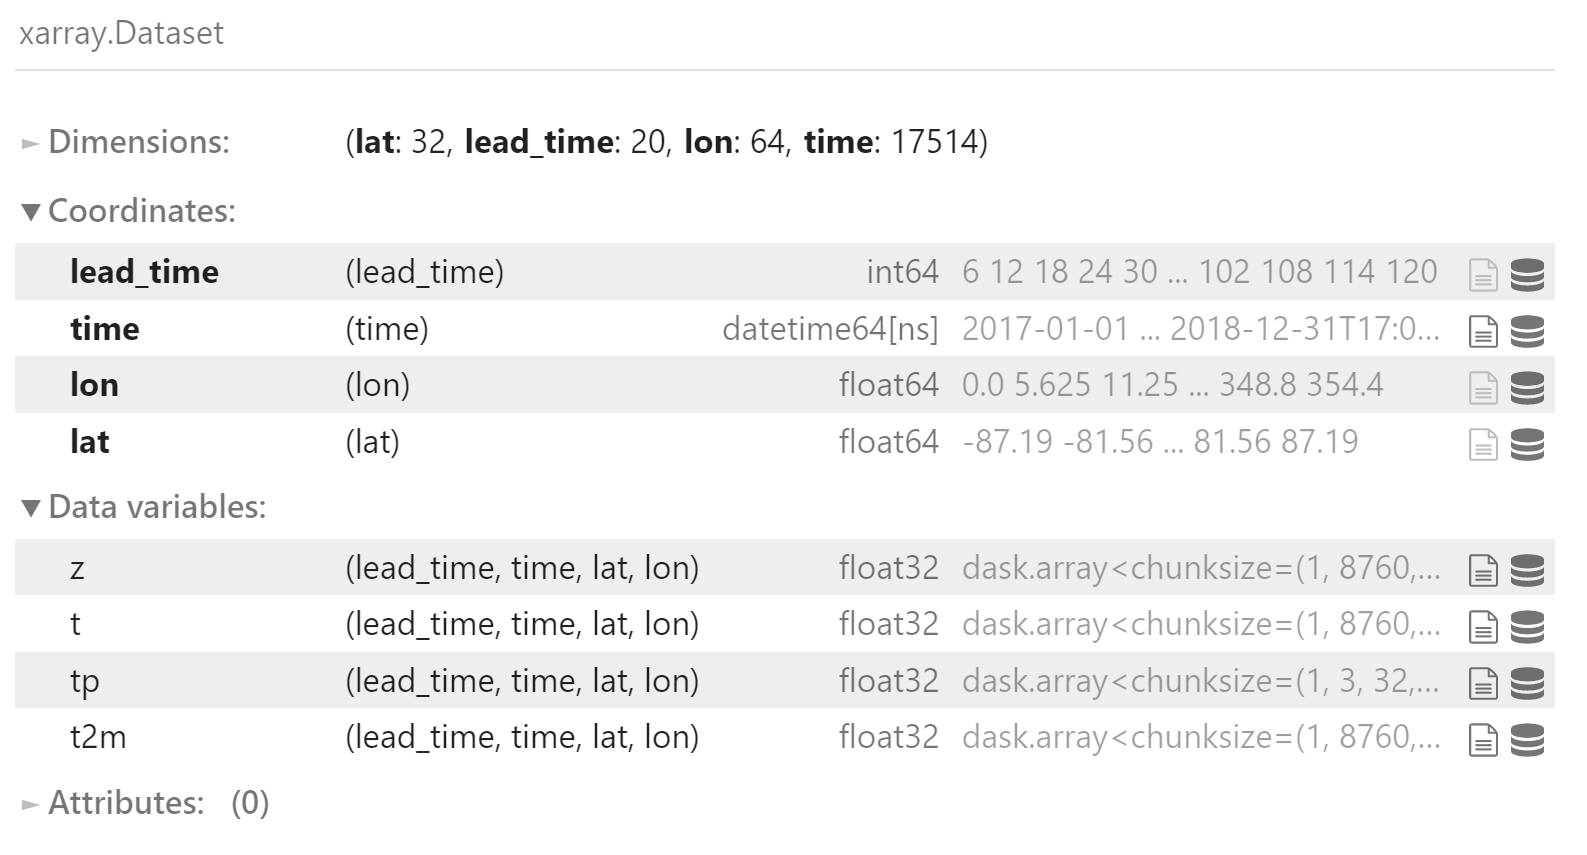
预报文件有如下的维度: [lead_time, init_time, lat, lon]
保存预报文件,用于后续评估
persistence.to_netcdf(f'{baseline_dir}/persistence_{res}.nc')
create_persistence_forecast() 函数返回 lead_time_h 小时前的实况,作为当前的预报
维度
time:起报时间,start time,将该起报时间作为预报时间 (start_time + lead_time_h) 的预报值
evaluate_iterative_forecast() 函数用于评估持续性预报,对 da_fc 的要求是 time 维度必须是起报时间。
def evaluate_iterative_forecast(da_fc, da_true, func, mean_dims=xr.ALL_DIMS):
    """
    Compute iterative score (given by func) with latitude weighting from two xr.DataArrays.
    Args:
        da_fc (xr.DataArray): Iterative Forecast. Time coordinate must be initialization time.
        da_true (xr.DataArray): Truth.
        mean_dims: dimensions over which to average score
    Returns:
        score: Latitude weighted score
    """
    rmses = []
    for f in da_fc.lead_time:
        fc = da_fc.sel(lead_time=f)
        fc['time'] = fc.time + np.timedelta64(int(f), 'h')
        rmses.append(func(fc, da_true, mean_dims))
    return xr.concat(rmses, 'lead_time')
气候态
Climatology
首先我们从全部训练数据集创建单一的气候态,即使用 2017 年之前的所有数据
def create_climatology_forecast(ds_train):
    return ds_train.mean('time')
选择 2017 年之前的数据作为训练数据
train_data = data.sel(time=slice(None, '2016'))
创建气候态
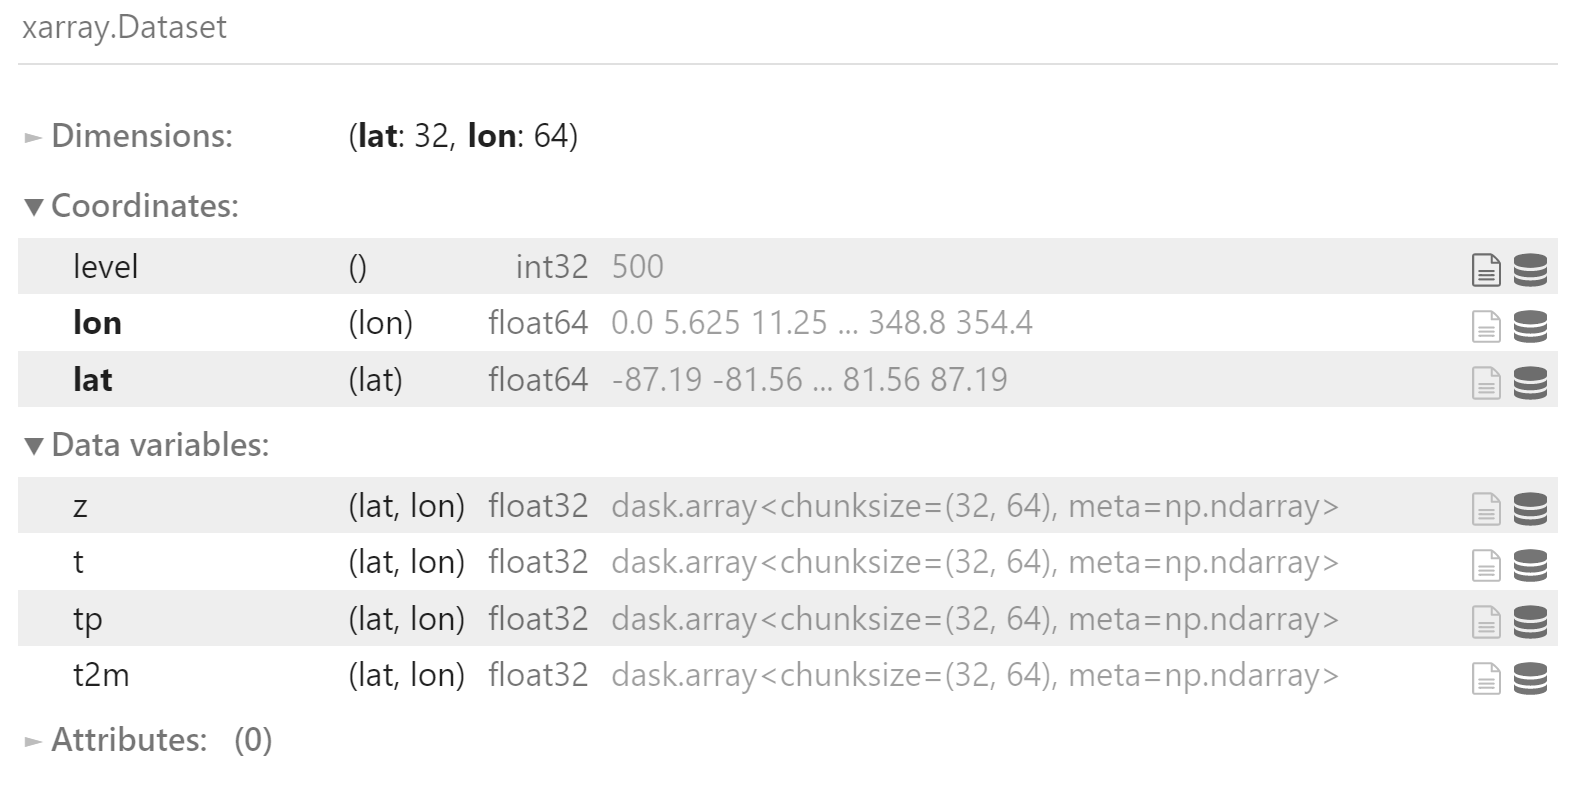
climatology = create_climatology_forecast(train_data)
climatology
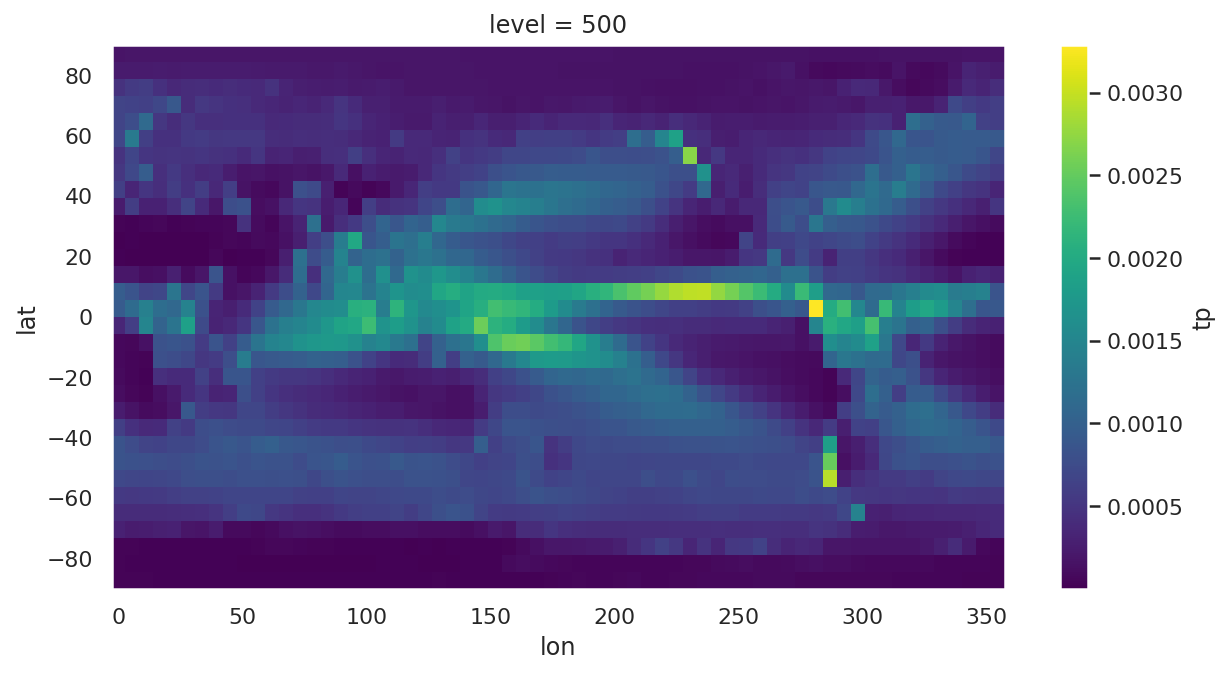
climatology.tp.plot(
    aspect=2,
    size=5
)
保存为 NetCDF 格式文件
climatology.to_netcdf(f'{baseline_dir}/climatology_{res}.nc')
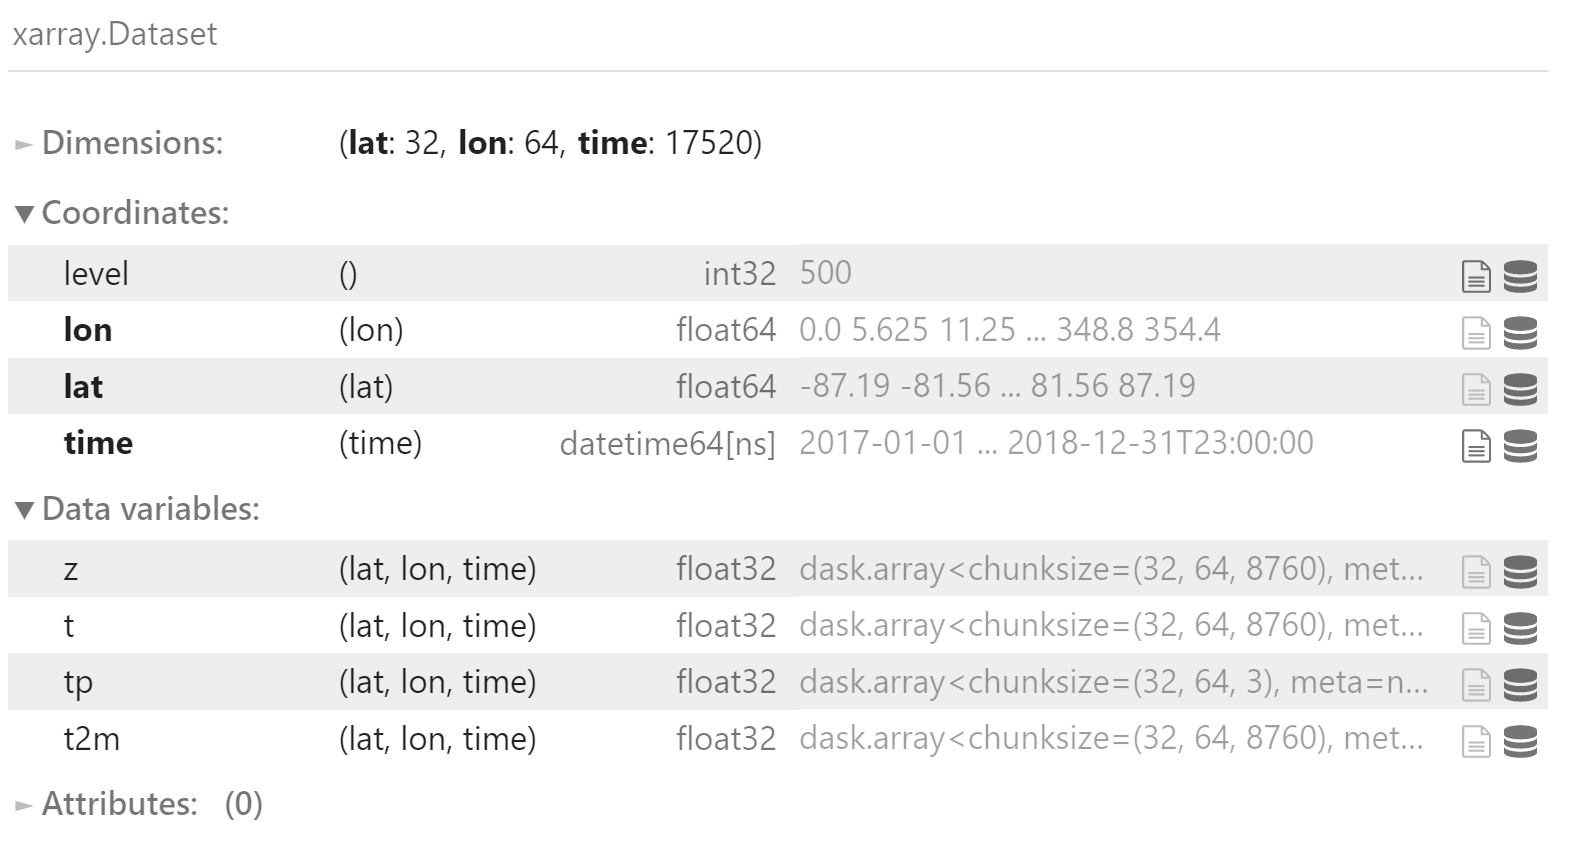
气候态仅有经纬度维度,与验证集比较时,xarray 会自动补全 time 维度
climatology - valid_data
逐周气候态
Weekly Climatology
考虑到季节周期,我们可以创造出更好的气候态。
我们将通过为每周创建一个单独的气候态来做到这一点。
def create_weekly_climatology_forecast(ds_train, valid_time):
    ds_train['week'] = ds_train['time.week']
    weekly_averages = ds_train.groupby('week').mean('time')
    valid_time['week'] = valid_time['time.week']
    fc_list = []
    for t in valid_time:
        fc_list.append(weekly_averages.sel(week=t.week))
    return xr.concat(fc_list, dim=valid_time)
weekly_climatology = create_weekly_climatology_forecast(
    train_data, valid_data.time
)
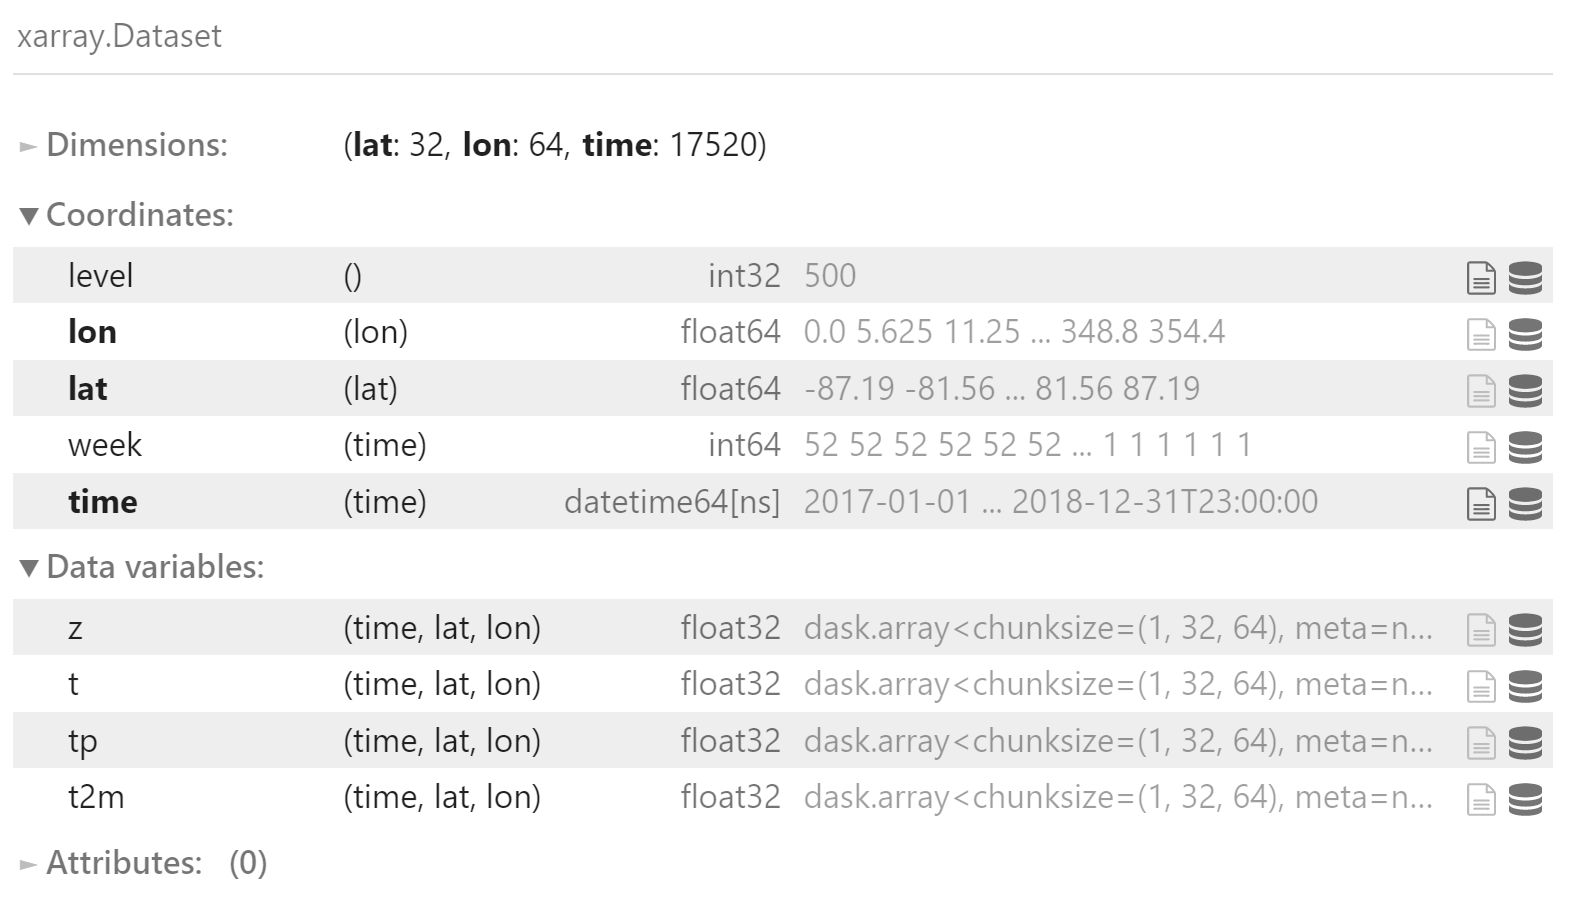
weekly_climatology
维度:
time:起报时间week:起报时间对应的星期数
保存成 NetCDF 文件
weekly_climatology.to_netcdf(
    f'{baseline_dir}/weekly_climatology_{res}.nc'
)
参考
论文
WeatherBench: A Benchmark Data Set for Data‐Driven Weather Forecasting
代码
https://github.com/pangeo-data/WeatherBench
WeatherBench 系列文章
