WeatherBench:查看数据集
介绍 WeatherBench 中由 ERA5 再分析资料制作的 5.625 度数据 (网格:32x64)
import numpy as np
import matplotlib.pyplot as plt
import pandas as pd
import xarray as xr

from pathlib import Path
文件说明
数据目录
base_path = "/g11/wangdp/data/weather-bench/5.625deg"
每个要素保存到单独的目录中,一共 17 个目录,16 个要素目录 + 1 个常量目录
[f.name for f in Path(base_path).iterdir() if not f.is_file()]
['10m_u_component_of_wind',
 '10m_v_component_of_wind',
 '2m_temperature',
 'constants',
 'geopotential',
 'geopotential_500',
 'potential_vorticity',
 'relative_humidity',
 'specific_humidity',
 'temperature',
 'temperature_850',
 'toa_incident_solar_radiation',
 'total_cloud_cover',
 'total_precipitation',
 'u_component_of_wind',
 'v_component_of_wind',
 'vorticity']
单个要素目录中,每个文件保存 1 年数据,一共 40 个文件
[f.name for f in Path(base_path, "temperature").iterdir() if f.is_file()]
['temperature_1979_5.625deg.nc',
 'temperature_1980_5.625deg.nc',
 'temperature_1981_5.625deg.nc',
 'temperature_1982_5.625deg.nc',
 'temperature_1983_5.625deg.nc',
 'temperature_1984_5.625deg.nc',
 'temperature_1985_5.625deg.nc',
 'temperature_1986_5.625deg.nc',
 'temperature_1987_5.625deg.nc',
 'temperature_1988_5.625deg.nc',
 'temperature_1989_5.625deg.nc',
 'temperature_1990_5.625deg.nc',
 'temperature_1991_5.625deg.nc',
 'temperature_1992_5.625deg.nc',
 'temperature_1993_5.625deg.nc',
 'temperature_1994_5.625deg.nc',
 'temperature_1995_5.625deg.nc',
 'temperature_1996_5.625deg.nc',
 'temperature_1997_5.625deg.nc',
 'temperature_1998_5.625deg.nc',
 'temperature_1999_5.625deg.nc',
 'temperature_2000_5.625deg.nc',
 'temperature_2001_5.625deg.nc',
 'temperature_2002_5.625deg.nc',
 'temperature_2003_5.625deg.nc',
 'temperature_2004_5.625deg.nc',
 'temperature_2005_5.625deg.nc',
 'temperature_2006_5.625deg.nc',
 'temperature_2007_5.625deg.nc',
 'temperature_2008_5.625deg.nc',
 'temperature_2009_5.625deg.nc',
 'temperature_2010_5.625deg.nc',
 'temperature_2011_5.625deg.nc',
 'temperature_2012_5.625deg.nc',
 'temperature_2013_5.625deg.nc',
 'temperature_2014_5.625deg.nc',
 'temperature_2015_5.625deg.nc',
 'temperature_2016_5.625deg.nc',
 'temperature_2017_5.625deg.nc',
 'temperature_2018_5.625deg.nc']
单层要素:2m 温度
variable_name = "2m_temperature"
short_name = "t2m"
year = 2013

file_path = Path(base_path, variable_name, f"{variable_name}_{year}_5.625deg.nc")
file_path
PosixPath('/g11/wangdp/data/weather-bench/5.625deg/2m_temperature/2m_temperature_2013_5.625deg.nc')
加载单个文件
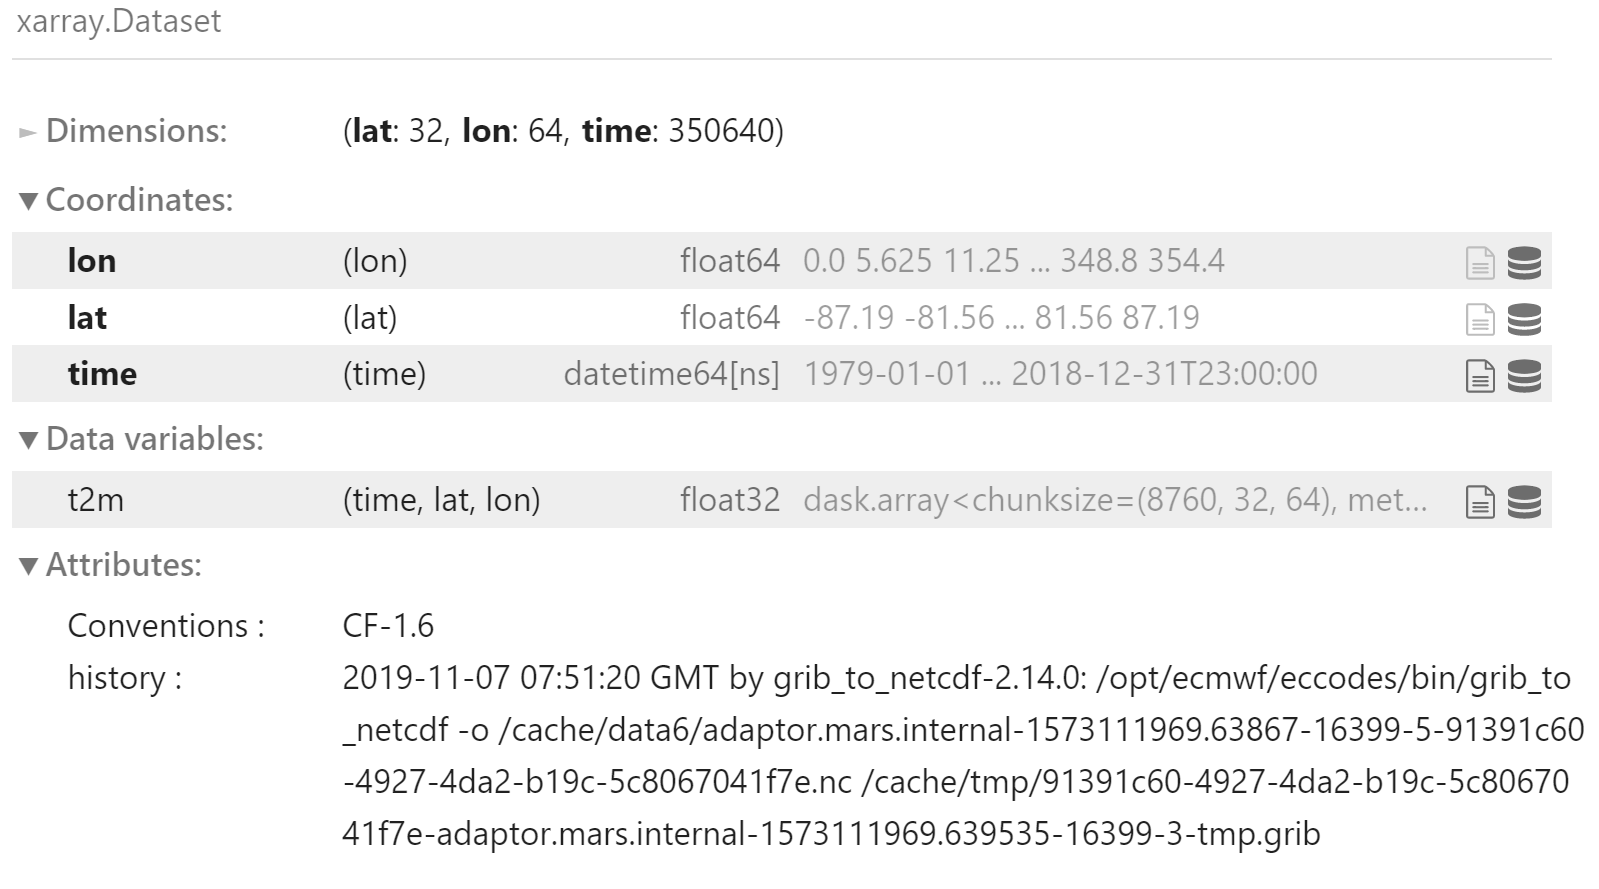
ds = xr.open_dataset(file_path)
ds
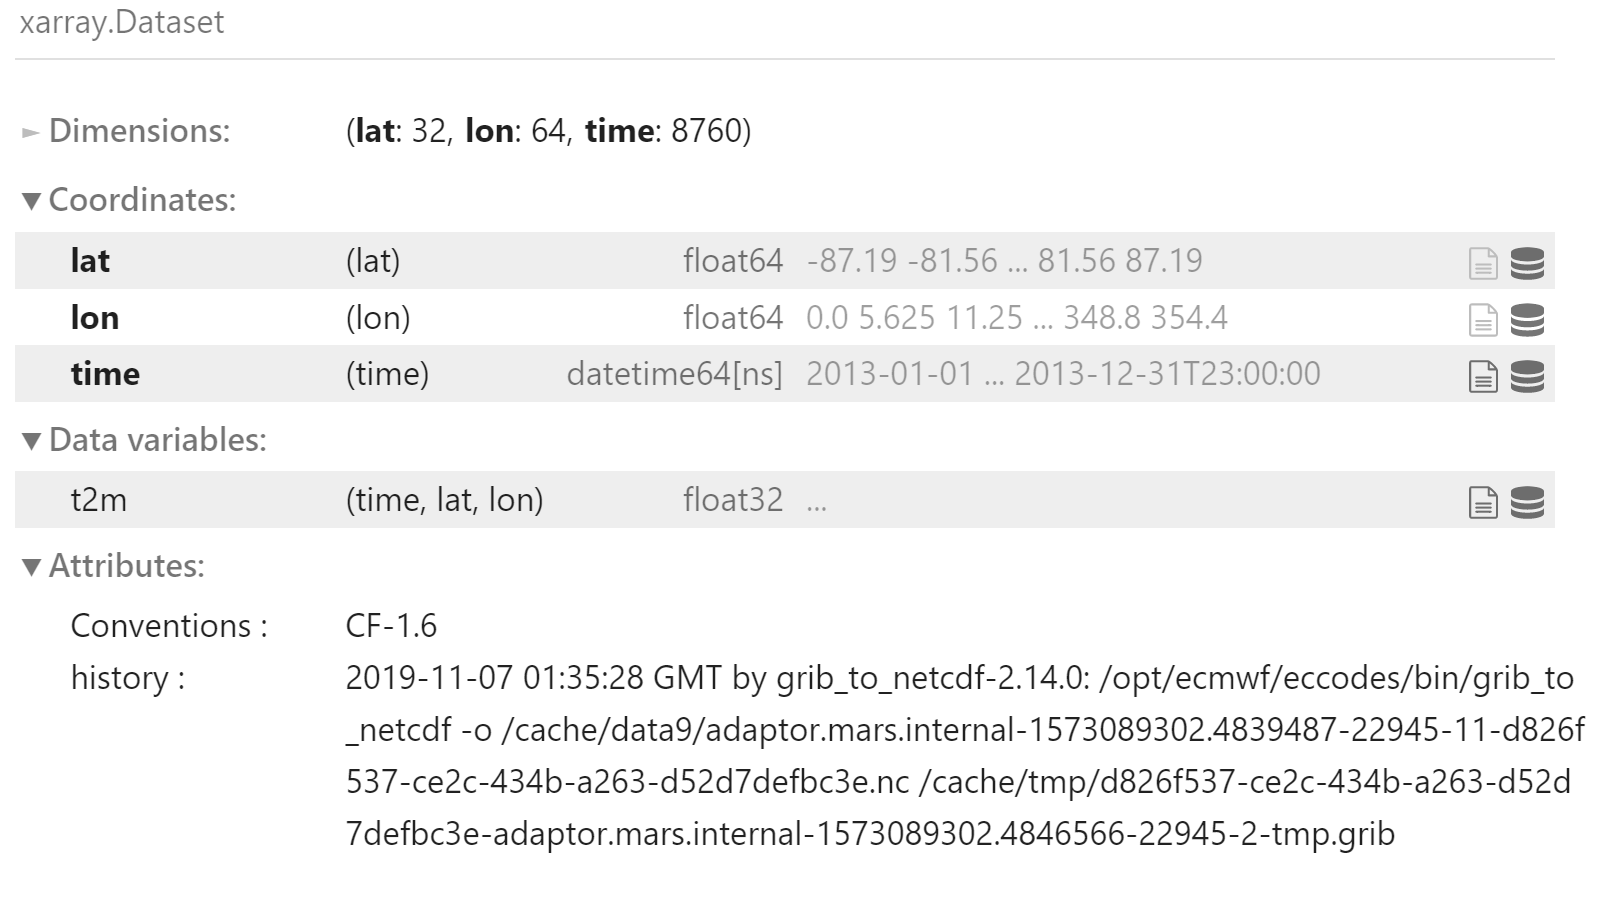
每个文件中只有一个要素场:
- t2m
ds.t2m
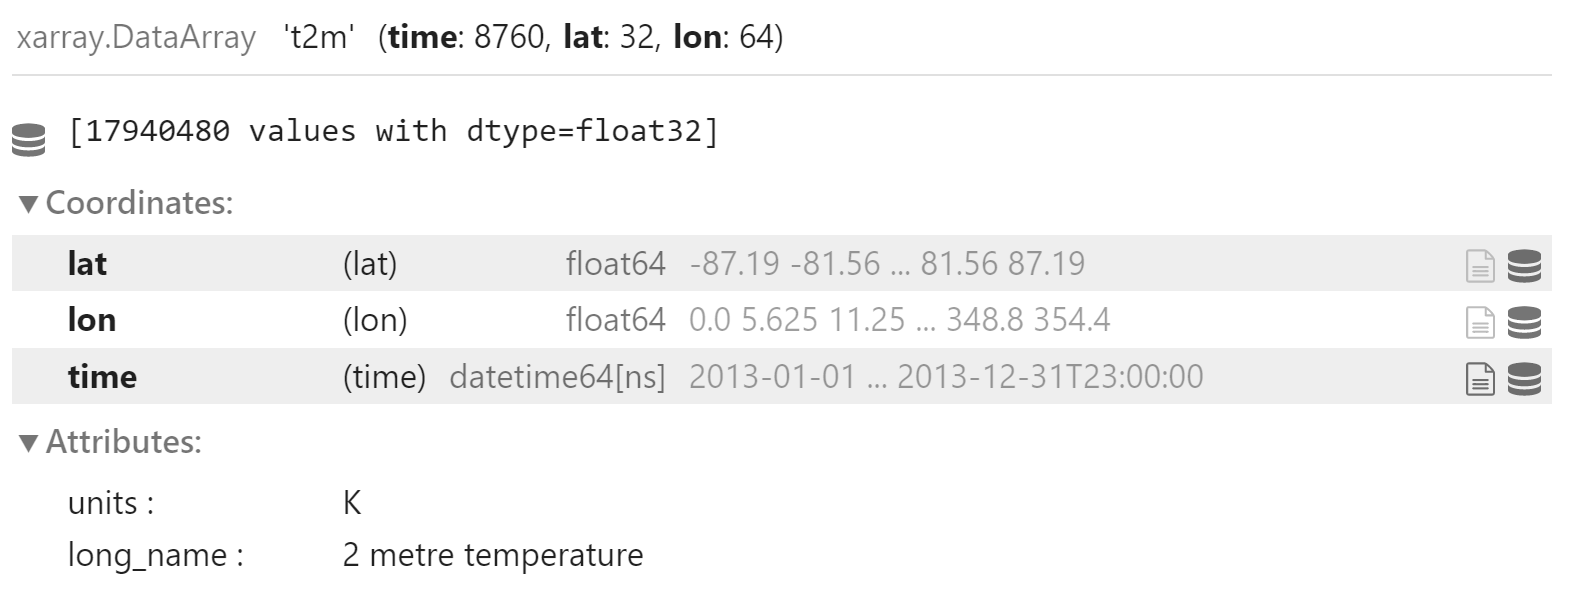
包含三个维度:
- 时间,逐小时
- 纬度,从南到北
- 经度
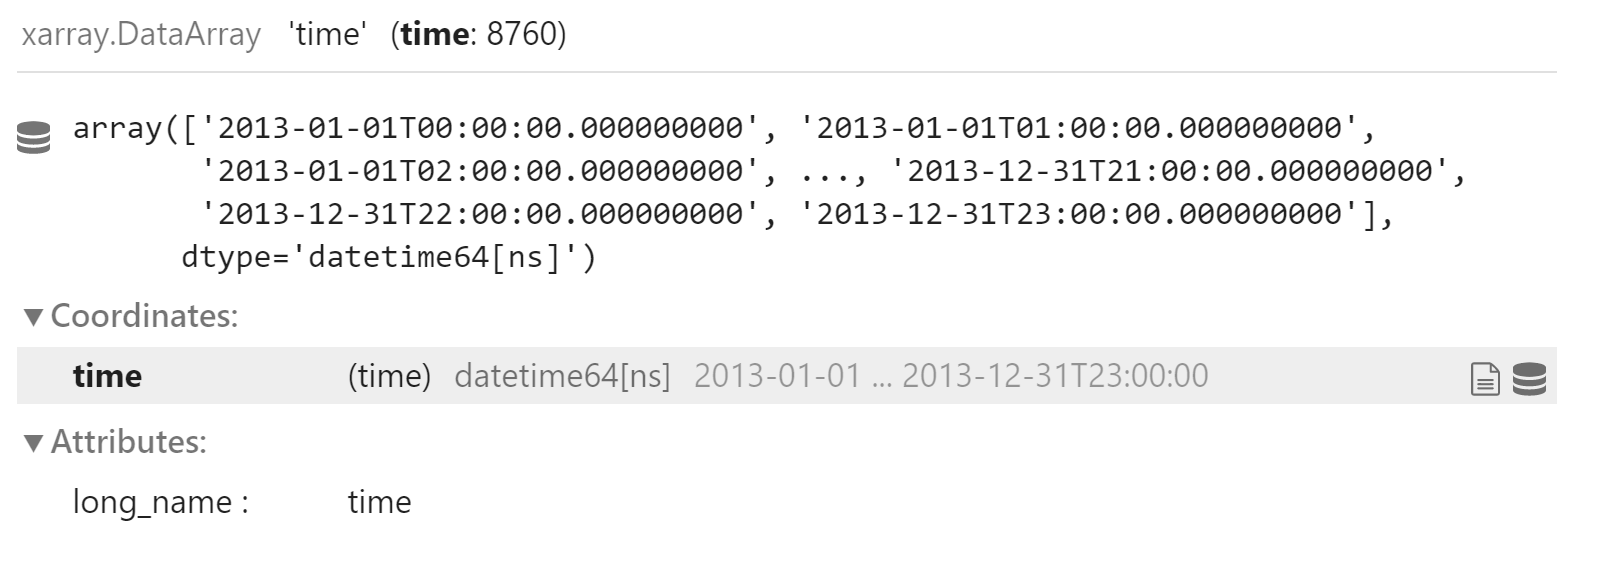
时间
从 1 月 1 日 00:00 到 12 月 31 日 23:00,1 小时间隔
ds.time
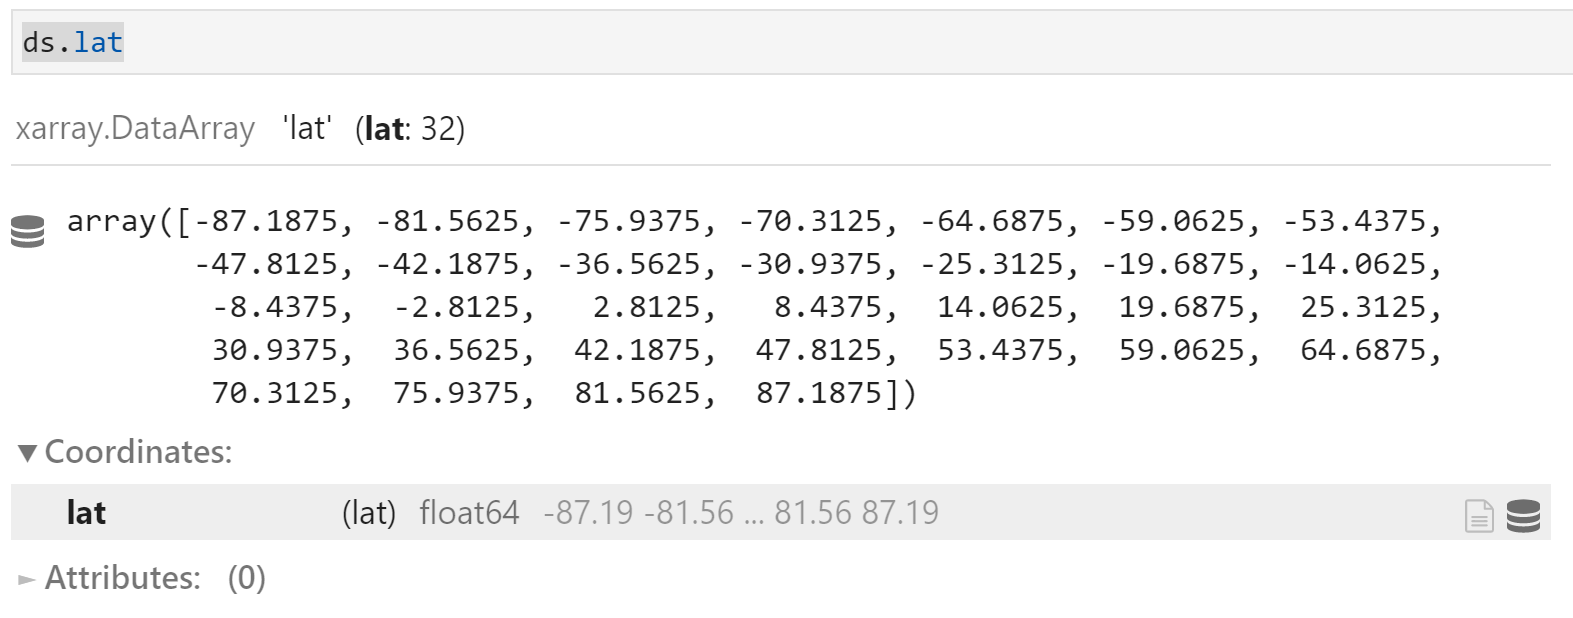
纬度
从 -87.1875 到 87.1875,间隔 5.625,一共 32 个值
沿 0 度两侧对称分布
ds.lat
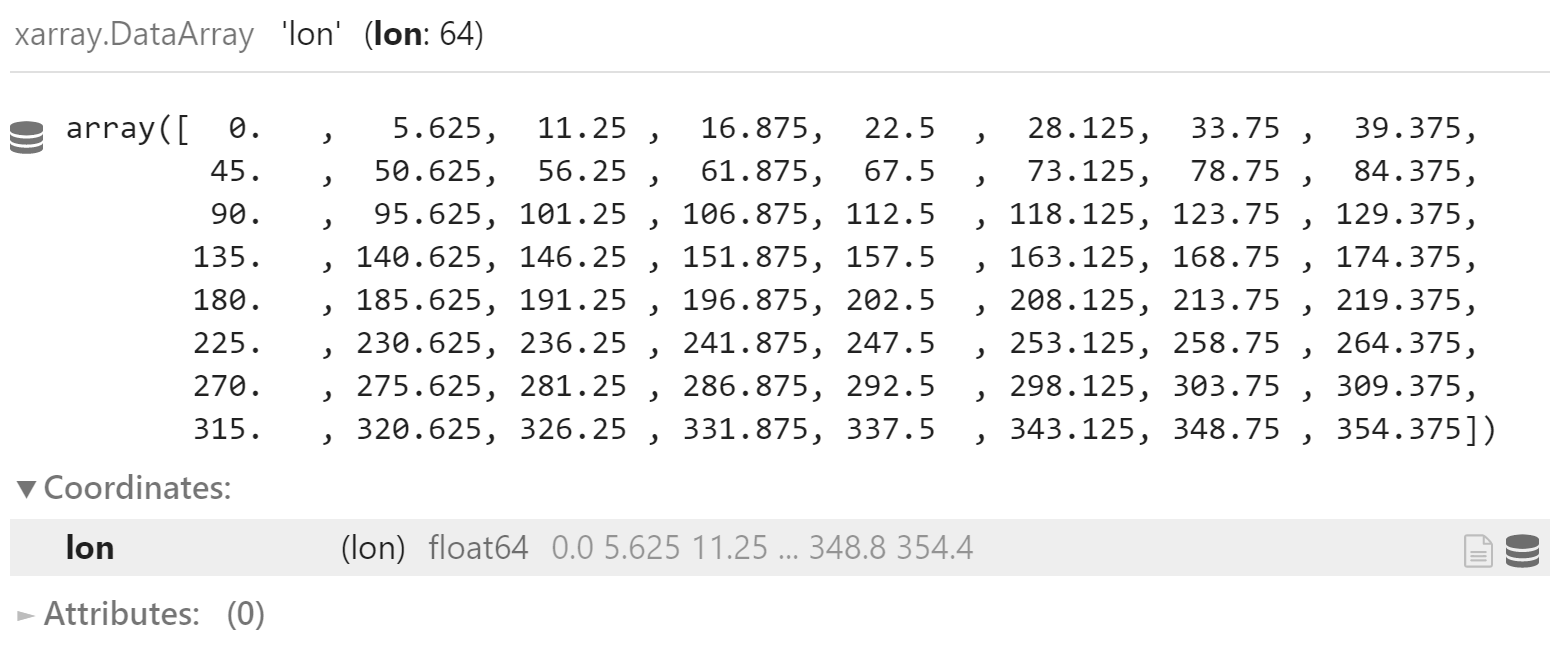
经度
从 0 到 354.375,间隔 5.625,一共 64 个值
筛选
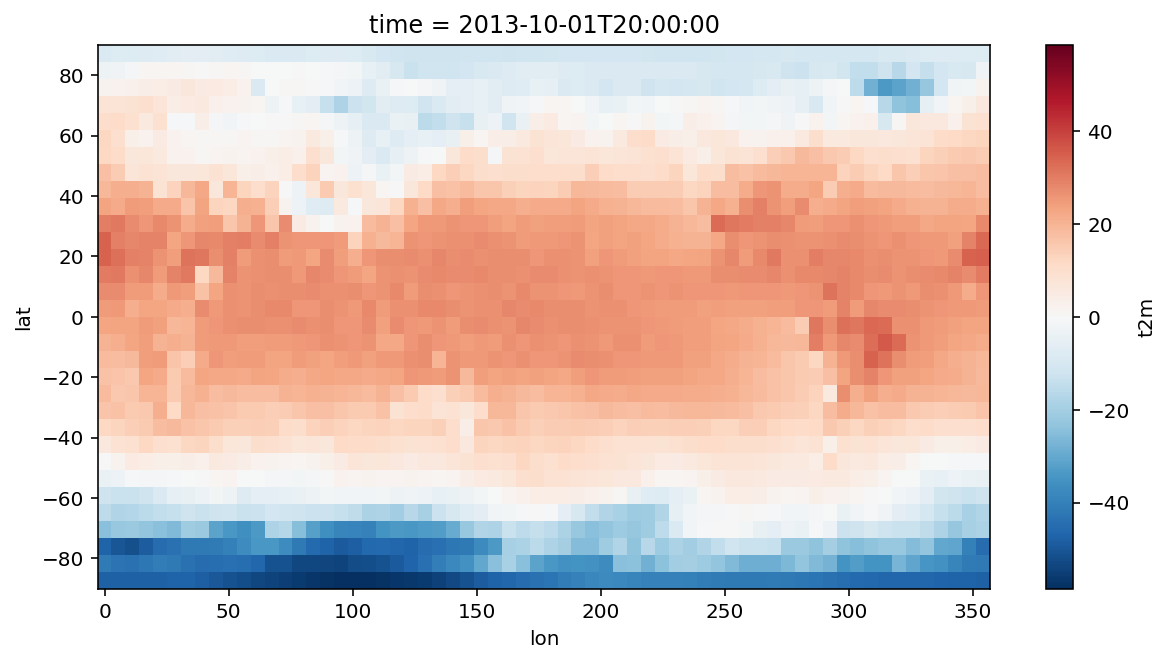
绘制 10 月 1 日 20:00 的 2m 温度
plt.figure(figsize=(10, 5))
(ds.t2m.sel(time="2013-10-01 20:00:00") - 273.15).plot()
plt.show()
加载多个文件
file_list = [
    Path(base_path, variable_name, f"{variable_name}_{year}_5.625deg.nc")
    for year in range(2010, 2015)
]
file_list
[PosixPath('/g11/wangdp/data/weather-bench/5.625deg/2m_temperature/2m_temperature_2010_5.625deg.nc'),
 PosixPath('/g11/wangdp/data/weather-bench/5.625deg/2m_temperature/2m_temperature_2011_5.625deg.nc'),
 PosixPath('/g11/wangdp/data/weather-bench/5.625deg/2m_temperature/2m_temperature_2012_5.625deg.nc'),
 PosixPath('/g11/wangdp/data/weather-bench/5.625deg/2m_temperature/2m_temperature_2013_5.625deg.nc'),
 PosixPath('/g11/wangdp/data/weather-bench/5.625deg/2m_temperature/2m_temperature_2014_5.625deg.nc')]
ds = xr.open_mfdataset(
    file_list,
    combine="by_coords"
)
ds
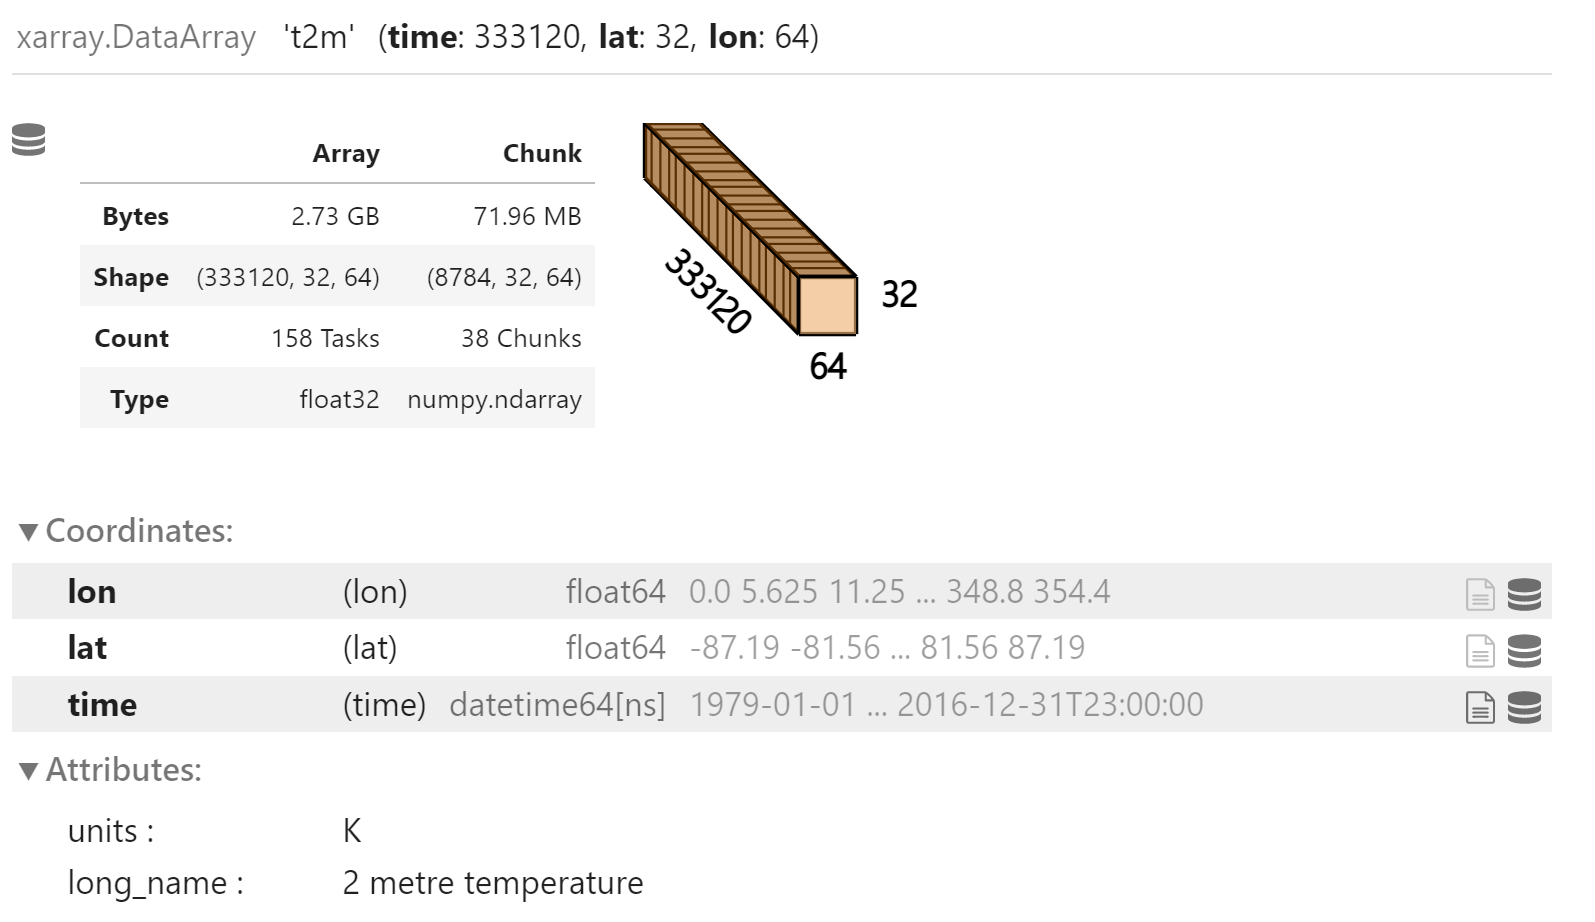
要素场
ds.t2m
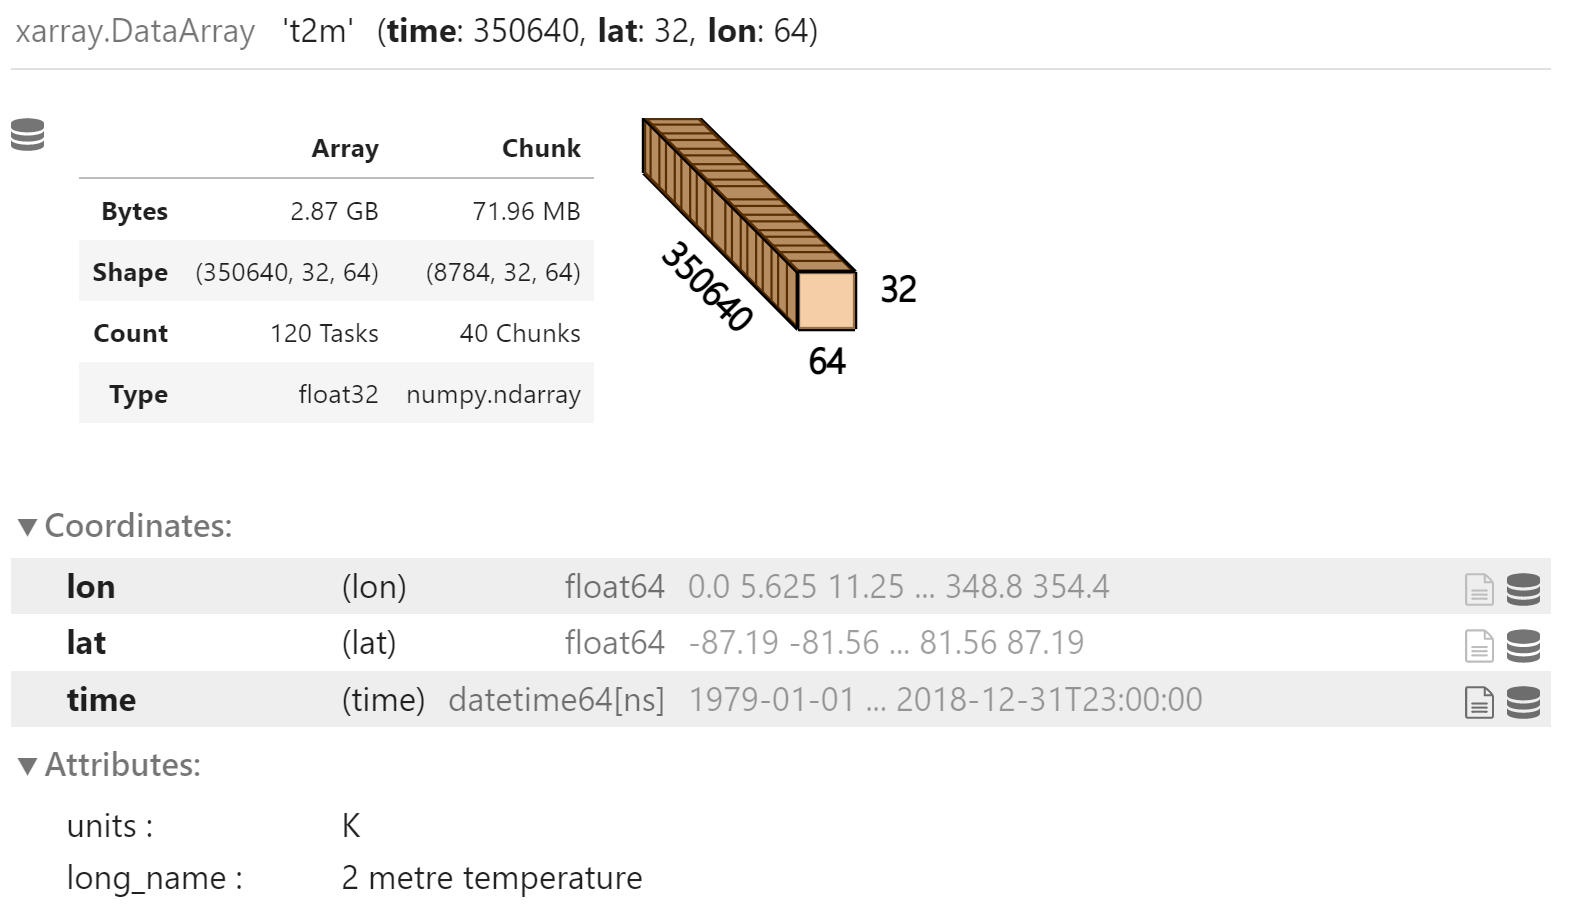
当前的数据值是 Dask 的 chunk,整个数据集被分成 40 个 chunk,与文件个数相同。
只有实际访问时才会从文件中读取数据值。
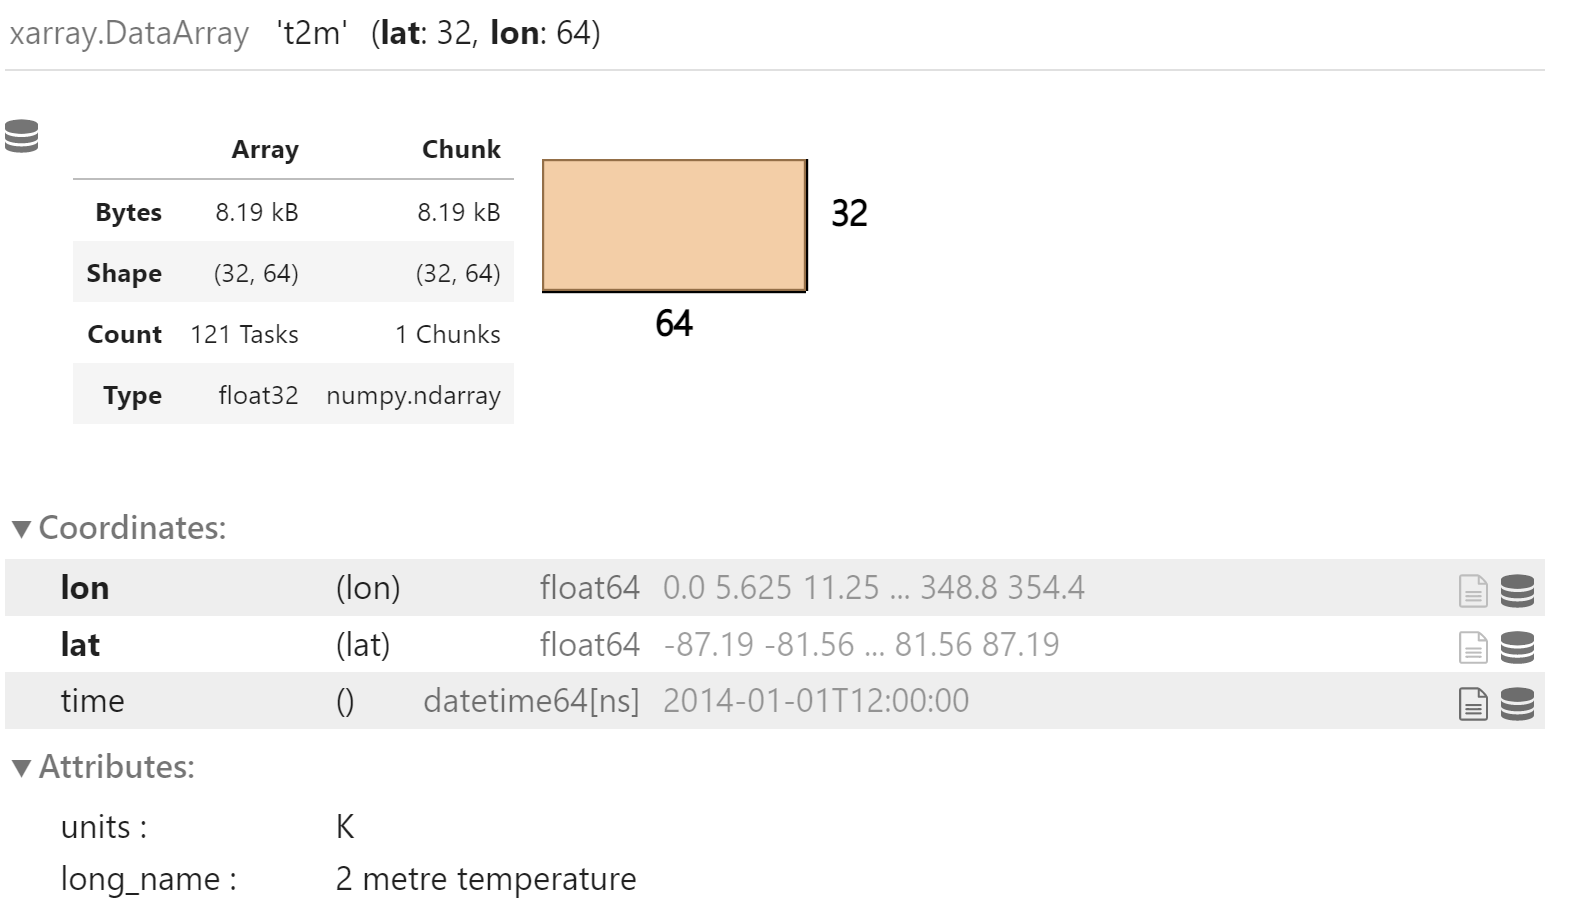
选择
获取 2014 年 1 月 1 日 12 时的 2m 温度要素场
选择 2016 年及之前的数据作为训练集
ds.t2m.sel(time=slice(None, "2016"))
多层要素:温度
variable_name = "temperature"
short_name = "t"
year = 2013

file_path = Path(base_path, variable_name, f"{variable_name}_{year}_5.625deg.nc")
file_path
PosixPath('/g11/wangdp/data/weather-bench/5.625deg/temperature/temperature_2013_5.625deg.nc')
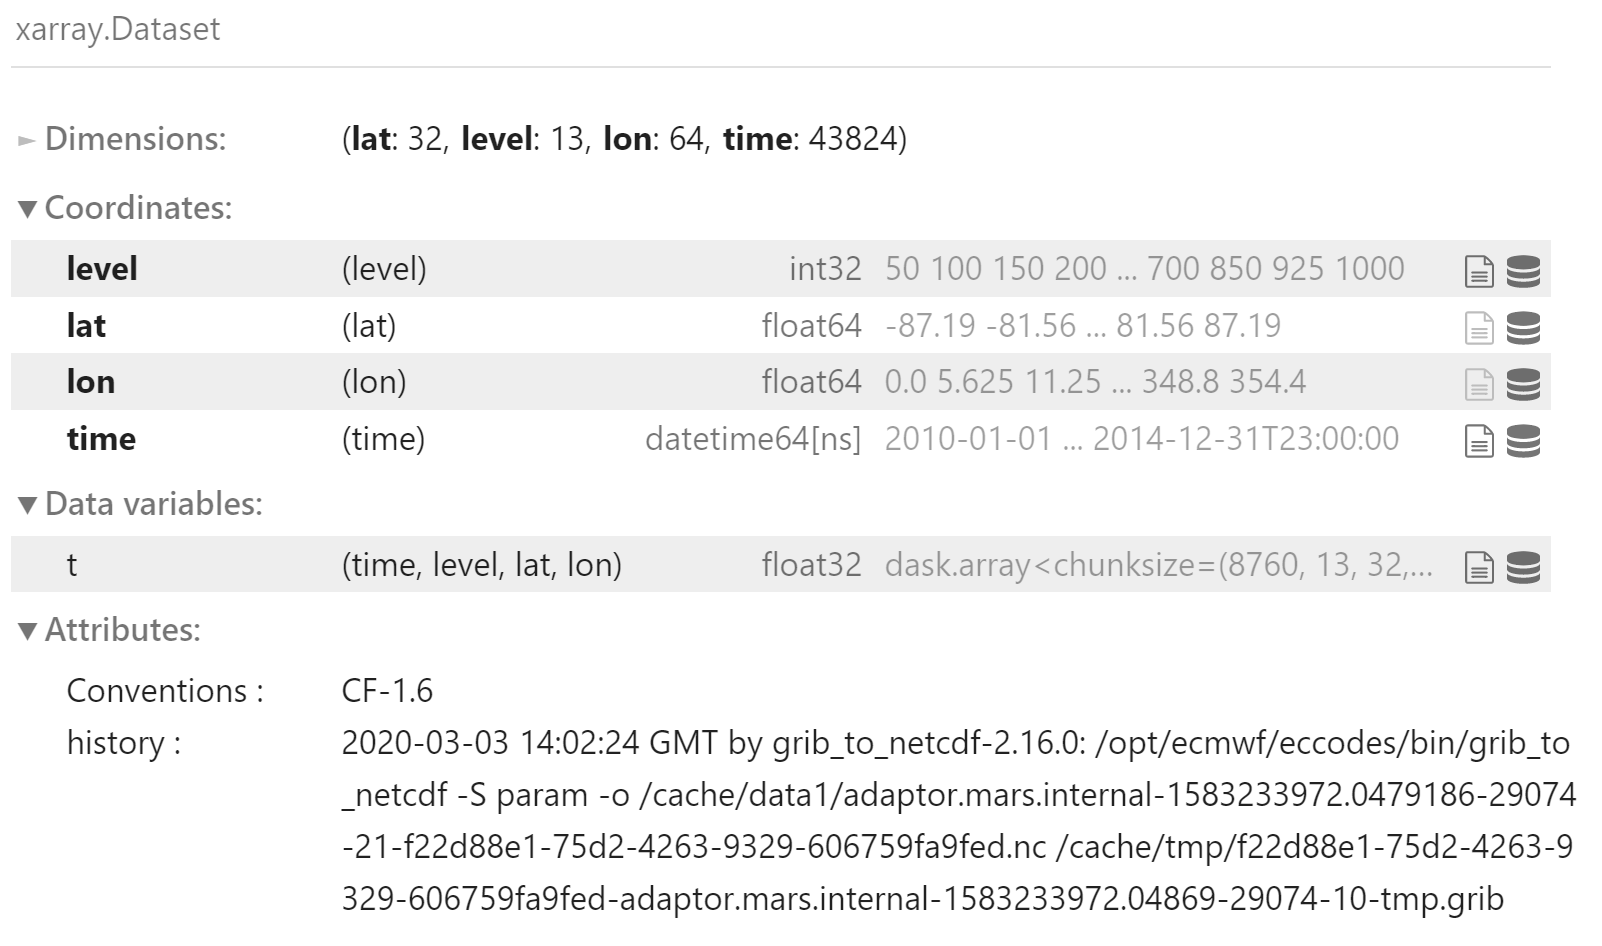
加载单个文件
ds = xr.open_dataset(file_path)
ds
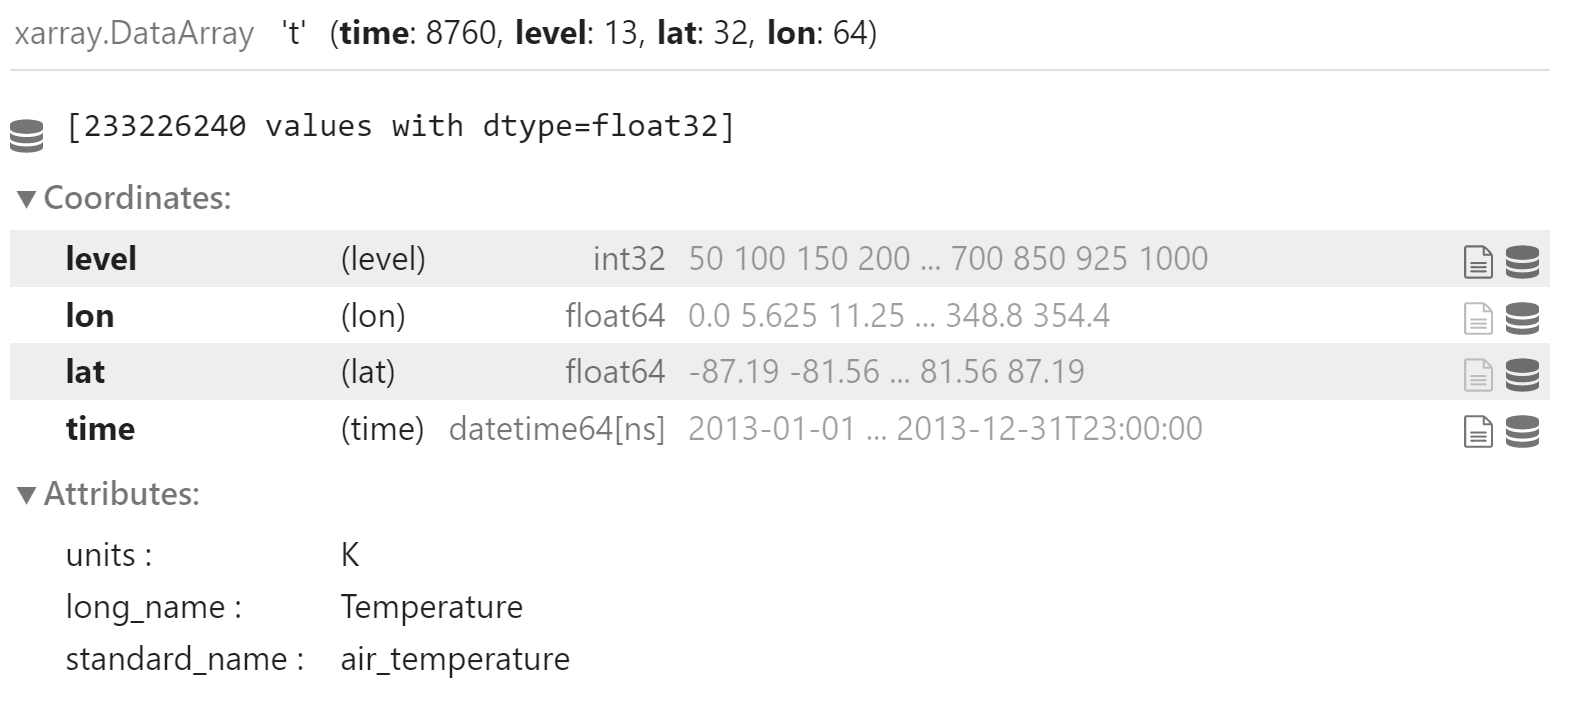
每个文件中只有一个要素场:
- t
包含四个维度:
- 时间,逐小时
- 层次,从高层到低层
- 纬度,从南到北
- 经度
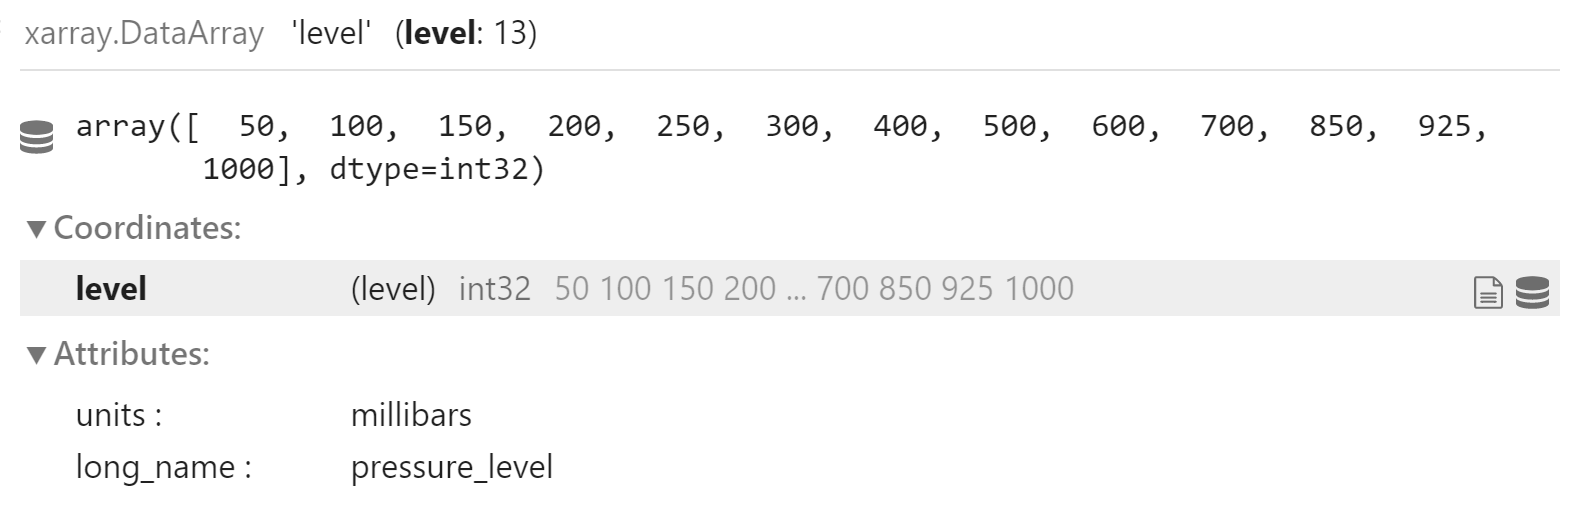
层次
从 50 到 1000 hPa,一共 13 个值
ds.level
筛选
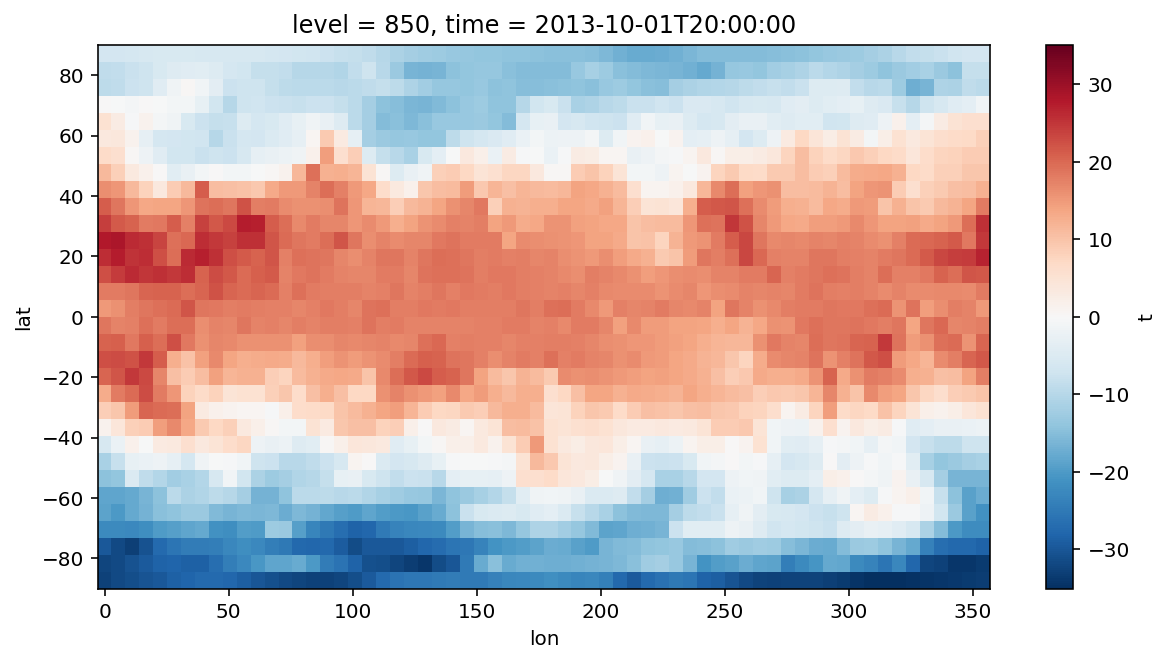
绘制 10 月 1 日 20:00 的 850hPa 温度
plt.figure(figsize=(10, 5))
(ds.t.sel(time="2013-10-01 20:00:00", level=850) - 273.15).plot()
plt.show()

加载多个文件
file_list = [
    Path(base_path, variable_name, f"{variable_name}_{year}_5.625deg.nc")
    for year in range(2010, 2015)
]
file_list
[PosixPath('/g11/wangdp/data/weather-bench/5.625deg/temperature/temperature_2010_5.625deg.nc'),
 PosixPath('/g11/wangdp/data/weather-bench/5.625deg/temperature/temperature_2011_5.625deg.nc'),
 PosixPath('/g11/wangdp/data/weather-bench/5.625deg/temperature/temperature_2012_5.625deg.nc'),
 PosixPath('/g11/wangdp/data/weather-bench/5.625deg/temperature/temperature_2013_5.625deg.nc'),
 PosixPath('/g11/wangdp/data/weather-bench/5.625deg/temperature/temperature_2014_5.625deg.nc')]
ds = xr.open_mfdataset(
    file_list,
    combine="by_coords"
)
ds
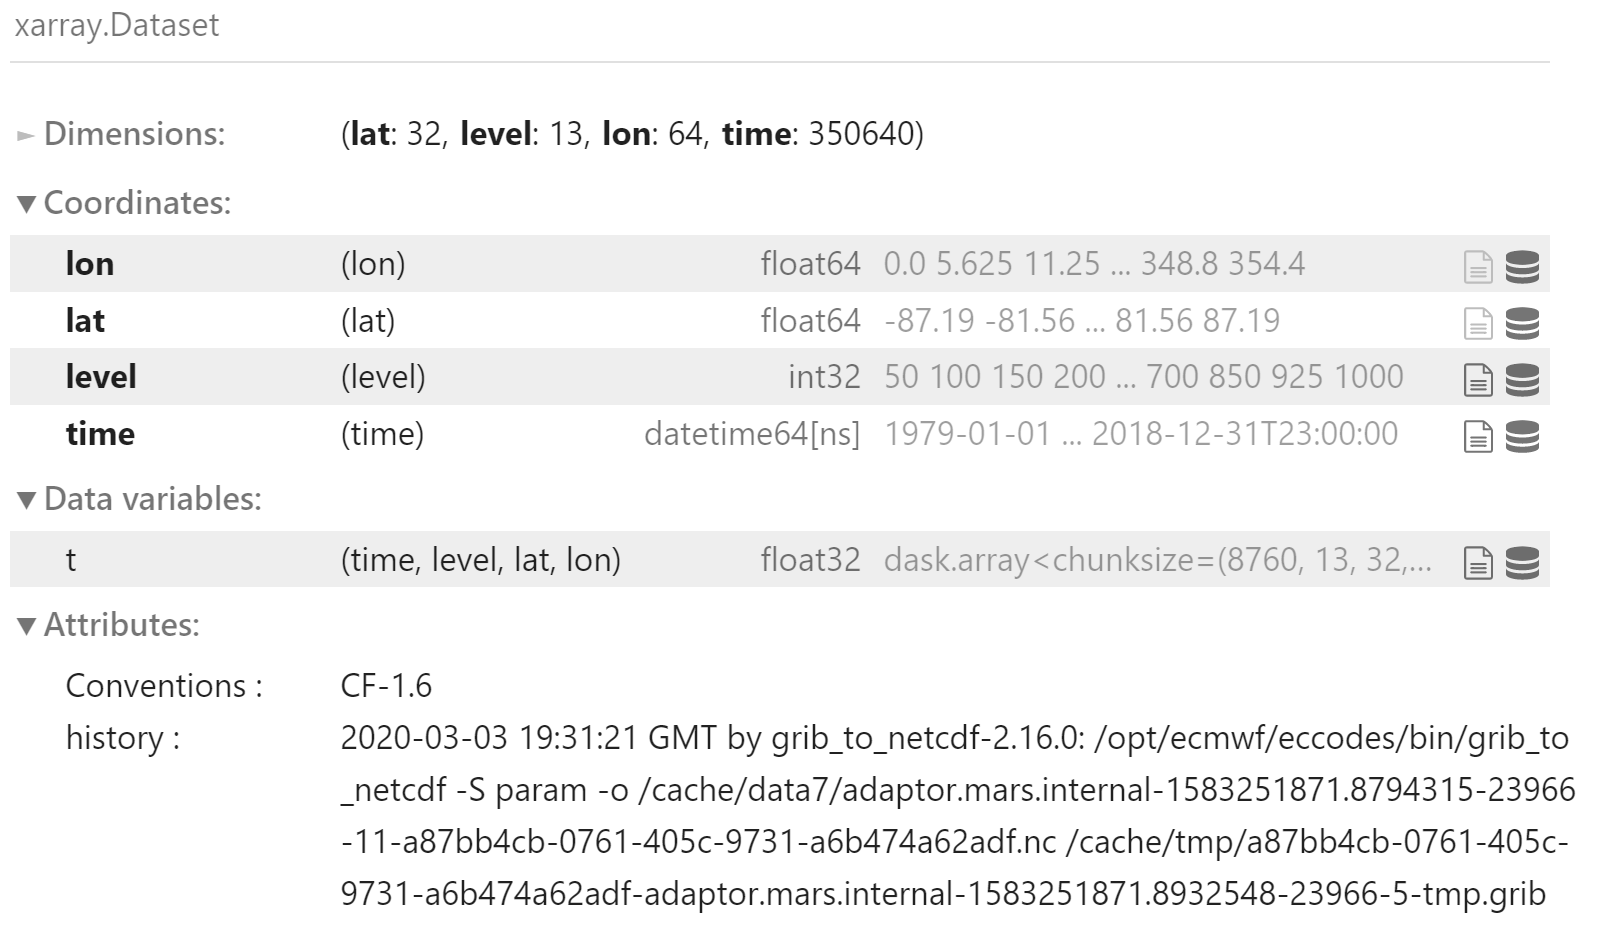
加载全部文件
field_directory = Path(base_path, variable_name)
file_pattern = f"{variable_name}_*_5.625deg.nc"
符合筛选条件的文件数
len(list(field_directory.glob(file_pattern)))
40
批量载入
ds = xr.open_mfdataset(
    str(Path(field_directory, file_pattern)),
    combine="by_coords"
)
ds
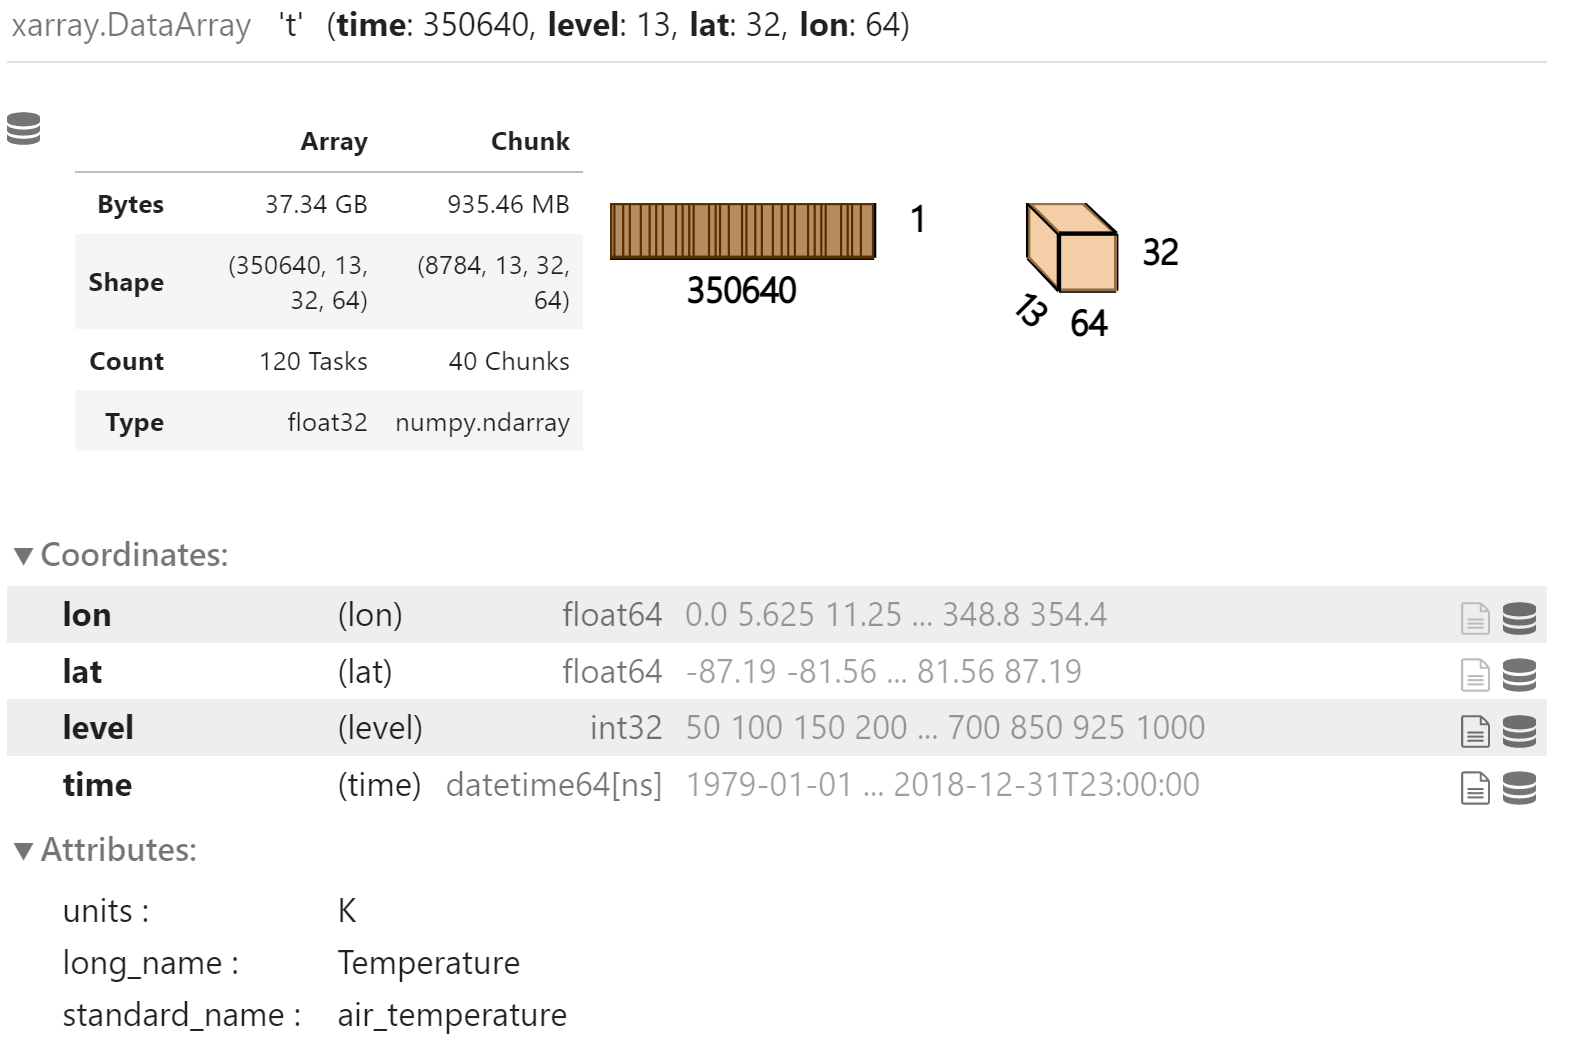
要素场
ds.t
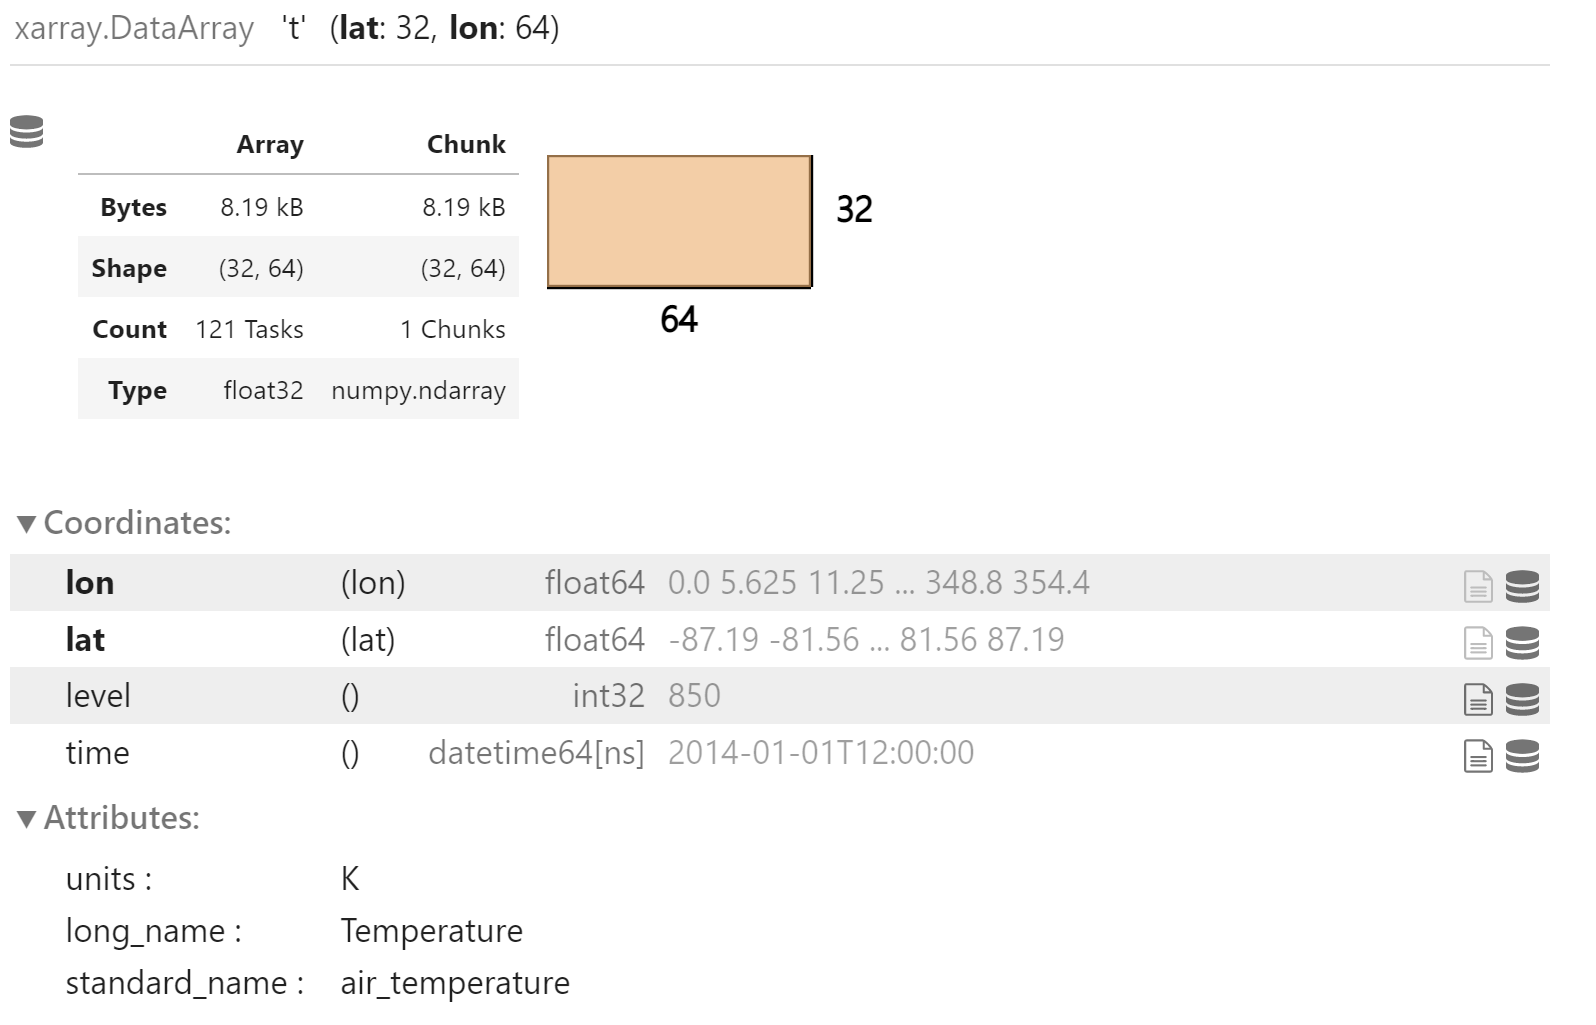
获取 2014 年 1 月 1 日 12 时的 850hPa 温度要素场
ds.t.sel(time="2014-01-01 12:00:00", level=850)
plt.figure(figsize=(10, 5))
(ds.t.sel(time="2013-10-01 20:00:00", level=850) - 273.15).plot()
plt.show()
计算:6 小时累计降水
加载全部逐小时降水数据
tp = xr.open_mfdataset(
    str(Path(base_path, "total_precipitation", "*.nc")),
    combine='by_coords'
).tp
tp
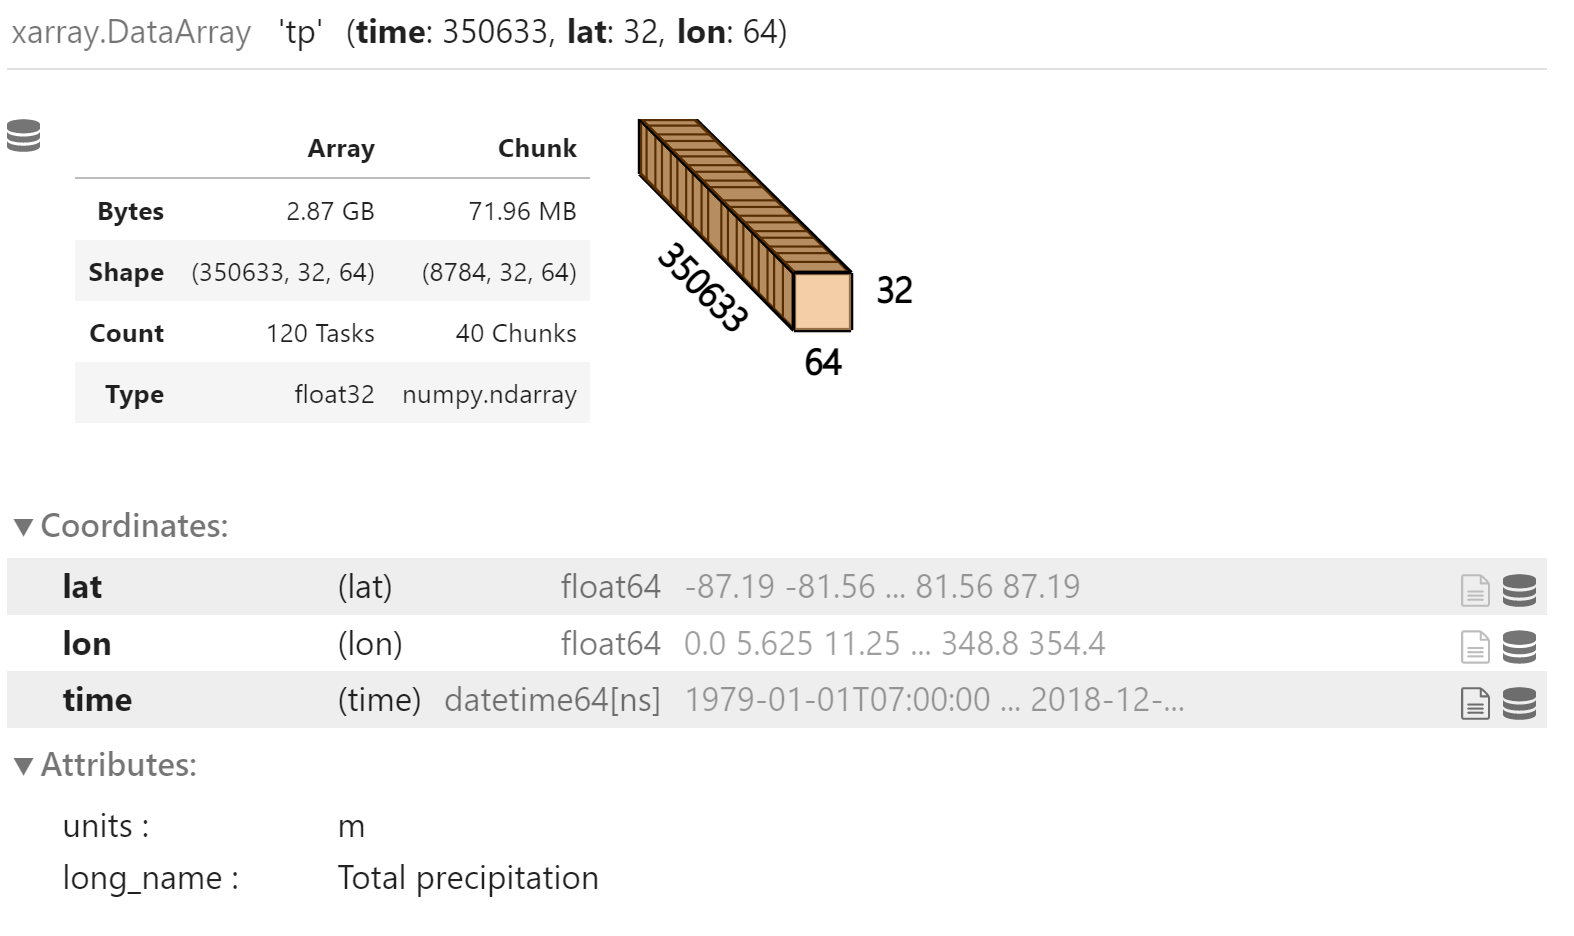
计算 6 小时累计降水
tp_6h = tp.rolling(time=6).sum()
tp_6h

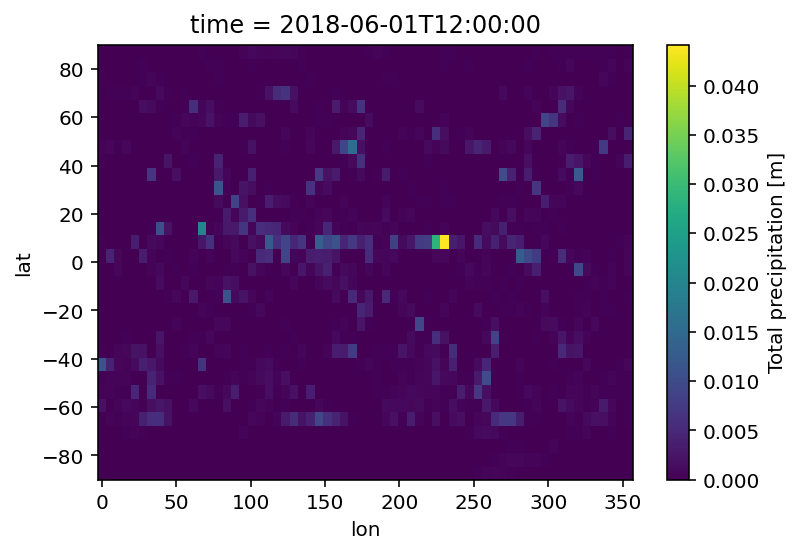
绘制 2018 年 6 月 1 日 12 时 6 小时累计降水,即 06:00 - 12:00 降水量
tp_6h.sel(time="2018-06-01 12:00").plot()
多要素
加载多个要素,包含两个多层要素和一个单层要素:
- 位势高度 (多层)
- 温度 (多层)
- 2m 温度 (单层)
z = xr.open_mfdataset(
    str(Path(base_path, "geopotential", "*.nc")),
    combine='by_coords'
).z
t = xr.open_mfdataset(
    str(Path(base_path, "temperature", "*.nc")),
    combine='by_coords'
).t
t2m = xr.open_mfdataset(
    str(Path(base_path, "2m_temperature", "*.nc")),
    combine='by_coords'
).t2m
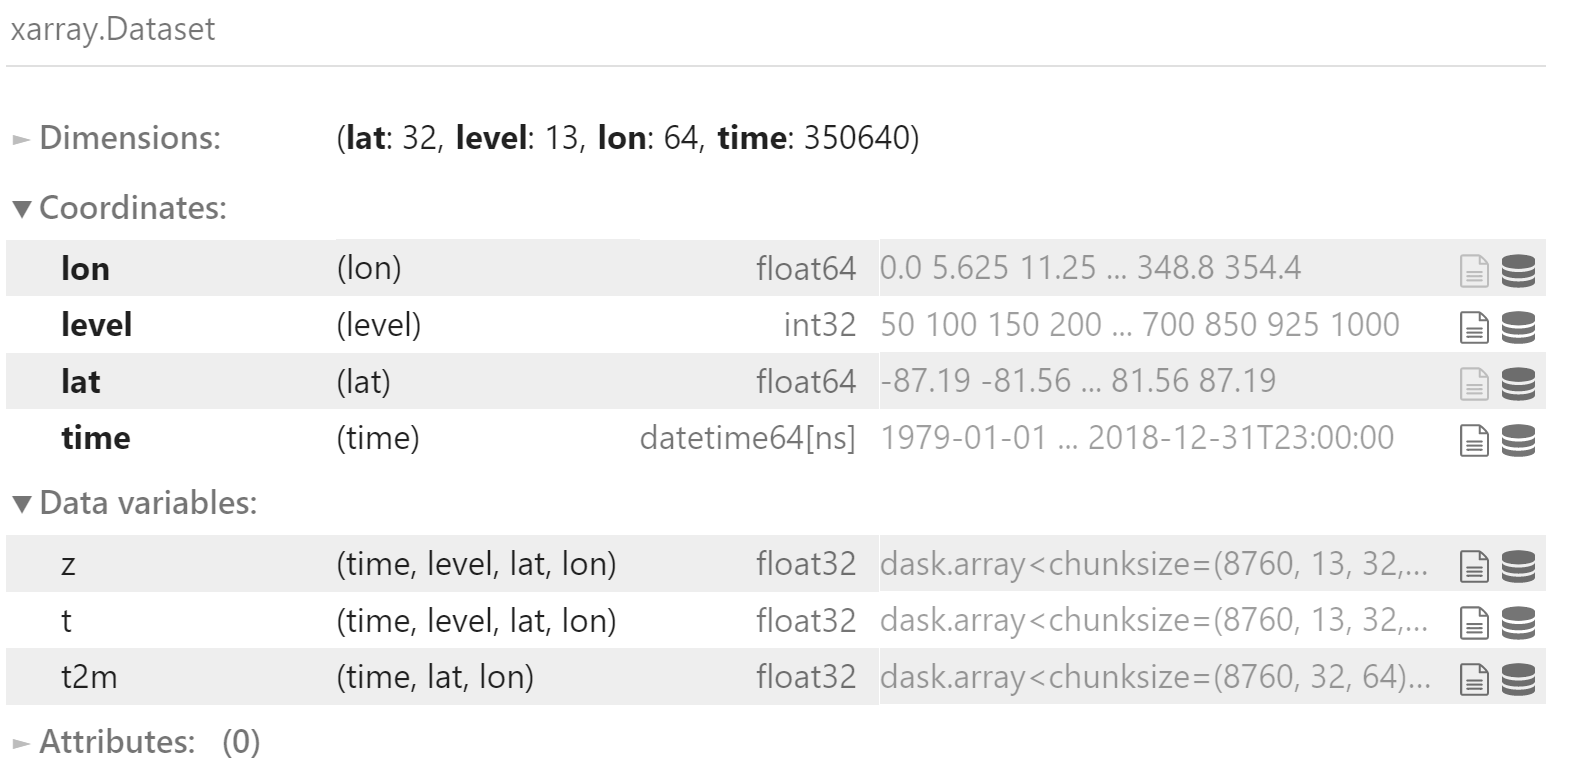
合并
使用 xarray.merge() 函数合并多个 xarray.Dataset 对象
data = xr.merge([z, t, t2m])
data
参考
论文
WeatherBench: A Benchmark Data Set for Data‐Driven Weather Forecasting
代码
https://github.com/pangeo-data/WeatherBench
WeatherBench 系列文章
