GRIB笔记:使用cfgrib加载垂直剖面图数据
本文介绍如何使用 cfgrib 加载绘制垂直剖面图需要的数据。
准备数据
使用 GRAPES GFS 模式的预报数据绘制温度场的垂直剖面图。 对于 GRAPES 模式来说,某个预报时效所有层次的变量都保存到同一个文件中,所以从单个文件中就能获取绘制剖面图需要的所有数据。
使用 nwpc-oper/nwpc-data 提供的工具获取 CMA 二级存储上的文件路径。
from nwpc_data.data_finder import find_local_file
file_path = find_local_file(
    "grapes_gfs_gmf/grib2/orig",
    start_time="2020031800",
    forecast_time="105h",
)
print(file_path)
/sstorage1/COMMONDATA/OPER/NWPC/GRAPES_GFS_GMF/Prod-grib/2020031721/ORIG/gmf.gra.2020031800105.grb2
加载等压面层数据
使用 cfgrib 加载等压面的温度场需要设置筛选条件。 具体方法请参考《GRIB笔记:从GRIB 2文件中加载单个要素场》。
本文使用 nwpc-oper/nwpc-data 封装的函数获取温度场。
from nwpc_data.grib.cfgrib import load_field_from_file

short_name = "t"
level_type = "isobaricInhPa"
field = load_field_from_file(
    file_path=file_path,
    parameter=short_name,
    level_type=level_type,
)
field
<xarray.DataArray 't' (isobaricInhPa: 36, latitude: 720, longitude: 1440)>
[37324800 values with dtype=float32]
Coordinates:
time datetime64[ns] ...
step timedelta64[ns] ...
* isobaricInhPa (isobaricInhPa) int64 1000 975 950 925 900 850 ... 5 4 3 2 1
* latitude (latitude) float64 89.88 89.62 89.38 ... -89.38 -89.62 -89.88
* longitude (longitude) float64 0.0 0.25 0.5 0.75 ... 359.2 359.5 359.8
valid_time datetime64[ns] ...
Attributes:
GRIB_paramId: 130
GRIB_shortName: t
...skip...
long_name: Temperature
units: K
standard_name: air_temperature
可以看到我们加载了 1000hPa 到 1hPa 共 36 个温度场。
因为 cfgrib 只有在实际需要的时候才会实际解码数据,所以该步骤执行比较快。
纬度剖面
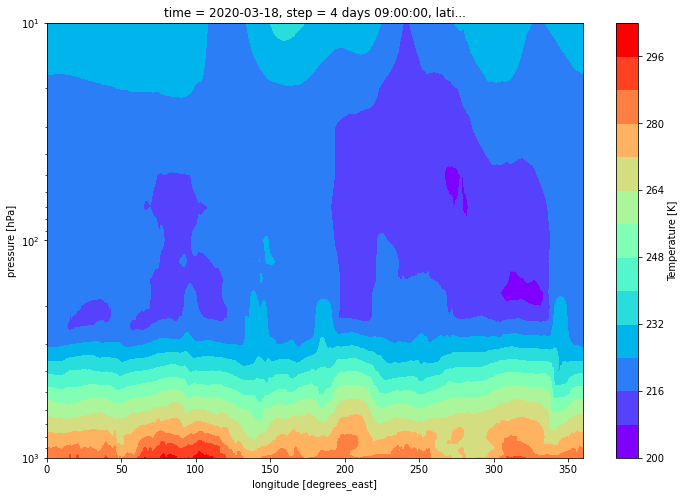
下面获取北纬 40 度的垂直剖面数据,使用 nearest 方法获取最近邻数据。
data = field.sel(isobaricInhPa=slice(1000, 10)).sel(latitude=40, method="nearest")
data
<xarray.DataArray 't' (isobaricInhPa: 30, longitude: 1440)>
array([[285.24582, 284.34583, 285.2958 , ..., 286.30582, 285.7958 , 285.4858 ],
[283.87183, 282.43182, 283.3918 , ..., 284.9218 , 284.4218 , 284.11182],
[281.7762 , 281.1062 , 281.90622, ..., 283.5162 , 283.00623, 282.7062 ],
...,
[220.40941, 220.4274 , 220.4134 , ..., 220.3704 , 220.3874 , 220.40341],
[222.9466 , 222.98059, 222.9796 , ..., 222.85759, 222.89159, 222.92659],
[226.7138 , 226.75381, 226.77481, ..., 226.64581, 226.66281, 226.6878 ]],
dtype=float32)
Coordinates:
time datetime64[ns] ...
step timedelta64[ns] ...
* isobaricInhPa (isobaricInhPa) int64 1000 975 950 925 900 ... 70 50 30 20 10
latitude float64 40.12
* longitude (longitude) float64 0.0 0.25 0.5 0.75 ... 359.2 359.5 359.8
valid_time datetime64[ns] ...
Attributes:
GRIB_paramId: 130
GRIB_shortName: t
...skip...
units: K
standard_name: air_temperature
可以看到,当我们实际访问数据值时,cfgrib 会自动加载数据。因此,这个步骤执行比较慢。
绘制剖面图
plot_color_map = "rainbow"
plot_levels = 15

data.plot.contourf(
    size=8,
    cmap=plot_color_map,
    yincrease=False,
    yscale="log",
    levels=plot_levels,
)
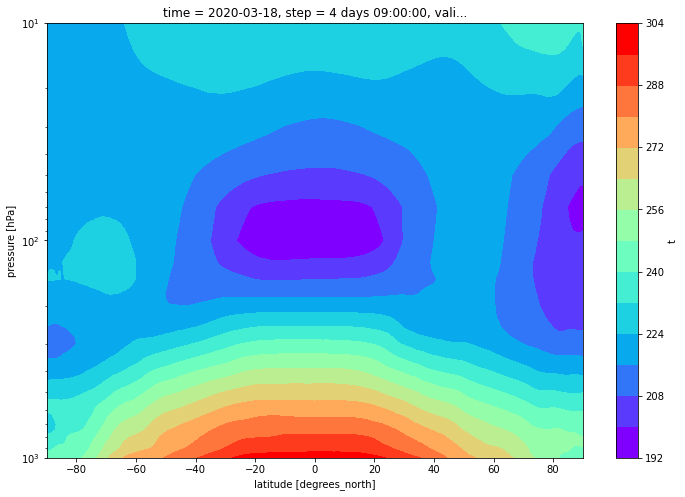
纬向平均
求纬向平均
data = field.sel(isobaricInhPa=slice(1000, 10)).mean(dim="longitude")
data
<xarray.DataArray 't' (isobaricInhPa: 30, latitude: 720)>
array([[245.58832, 245.59032, 245.58708, ..., 243.30983, 243.21802,
243.01901],
[244.7631 , 244.70699, 244.65994, ..., 242.19946, 242.10803,
241.90965],
[244.60265, 244.61296, 244.58246, ..., 241.06177, 240.97054,
240.77313],
...,
[210.05647, 210.44188, 210.44145, ..., 219.56932, 219.58511,
219.57982],
[219.7151 , 220.0383 , 220.11638, ..., 219.54369, 219.53702,
219.54031],
[236.6471 , 234.70645, 233.65495, ..., 219.78305, 219.78227,
219.77924]], dtype=float32)
Coordinates:
time datetime64[ns] 2020-03-18
step timedelta64[ns] 4 days 09:00:00
* isobaricInhPa (isobaricInhPa) int64 1000 975 950 925 900 ... 70 50 30 20 10
* latitude (latitude) float64 89.88 89.62 89.38 ... -89.38 -89.62 -89.88
valid_time datetime64[ns] 2020-03-22T09:00:00
绘制 zonal mean 图
data.plot.contourf(
    size=8,
    cmap=plot_color_map,
    yincrease=False,
    yscale="log",
    levels=plot_levels,
)
问题
cfgrib 加载数据时,会将层次类型 typeOfLevel 当成一个维度。
对于等压面层次, typeOfLevel 区分 isobaricInhPa 和 isobaricInPa。
笔者尚未找到合适的方法可以同时加载所有等压面层的数据。
另外,如果层次值是 1.5hPa,使用 isobaricInhPa 时 level 会被设置为 1,这就可能导致文件中有多个值为 1 的温度场。
使用 grib_ls 命令查看文件就会发现这个问题。
下一篇文章笔者会介绍使用 nwpc-oper/nwpc-data 封装的 eccodes-python 接口获取垂直剖面数据,可以直接加载所有的等压面场。
