计算站点降水的检验指标:列联表
本文以 24 小时累积降水为例,说明如何根据站点观测计算二分类预报的列联表,为后续计算检验指标提供基础数据。
重要提示:本文使用的数据均来自其他工具。
准备
载入需要使用到的库
import numpy as np
import pandas as pd
import xarray as xr

import geopandas as gpd
from shapely.geometry import Polygon

import matplotlib.pyplot as plt

import pathlib

from nwpc_data.grib.eccodes import load_field_from_file
参数
区域范围,仅计算区域内的观测
domain = [20, 55, 70, 145]
降水阈值,单位为 mm。为每个阈值分别计算列联表
thresholds = [0.1, 1, 5, 10, 25, 50, 100]
数据目录
forecast_root = "/base/run_grapes/ECMWF"
obs_rain_root = "/base/run_grapes/obsrain"
观测时刻,2020 年 8 月 1 日 00 时次
current_date = pd.to_datetime("2020-08-01 00:00:00")
选择 12 时次预报
current_start_hour = pd.Timedelta(hours=12)
仅计算 036 时效的 24 小时累积降水
current_forecast_hour = pd.Timedelta(hours=24) + current_start_hour
数据
观测数据
已从 GTS 数据中提取的降水数据,忽略 24 小时降水为缺失值的条目。
观测数据文件格式如下:
24-hr precip reports ending 12Z on 20180725
     -9.62    322.23      0.00 00086
     66.48     20.17      0.00 02151
     65.87     20.15      0.00 02154
     65.53     22.12      0.00 02186
     59.90     17.58      0.00 02458
     58.42     12.70      0.00 02520
     58.38     15.52      0.00 02562
     57.67     18.35      0.00 02590
     56.27     15.27      0.00 02664
观测数据文件路径
obs_rain_24 = pathlib.Path(
    obs_rain_root,
    f"cma24-dlyprcp-{current_date.strftime('%Y%m%d')}"
)
obs_rain_24
PosixPath('/base/run_grapes/obsrain/cma24-dlyprcp-20200801')
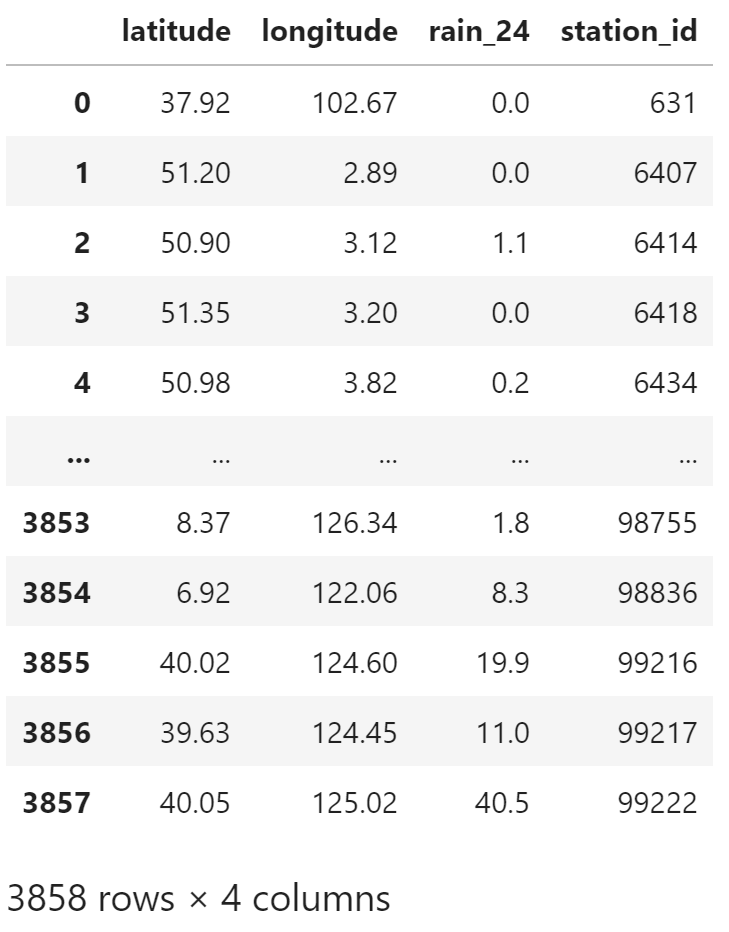
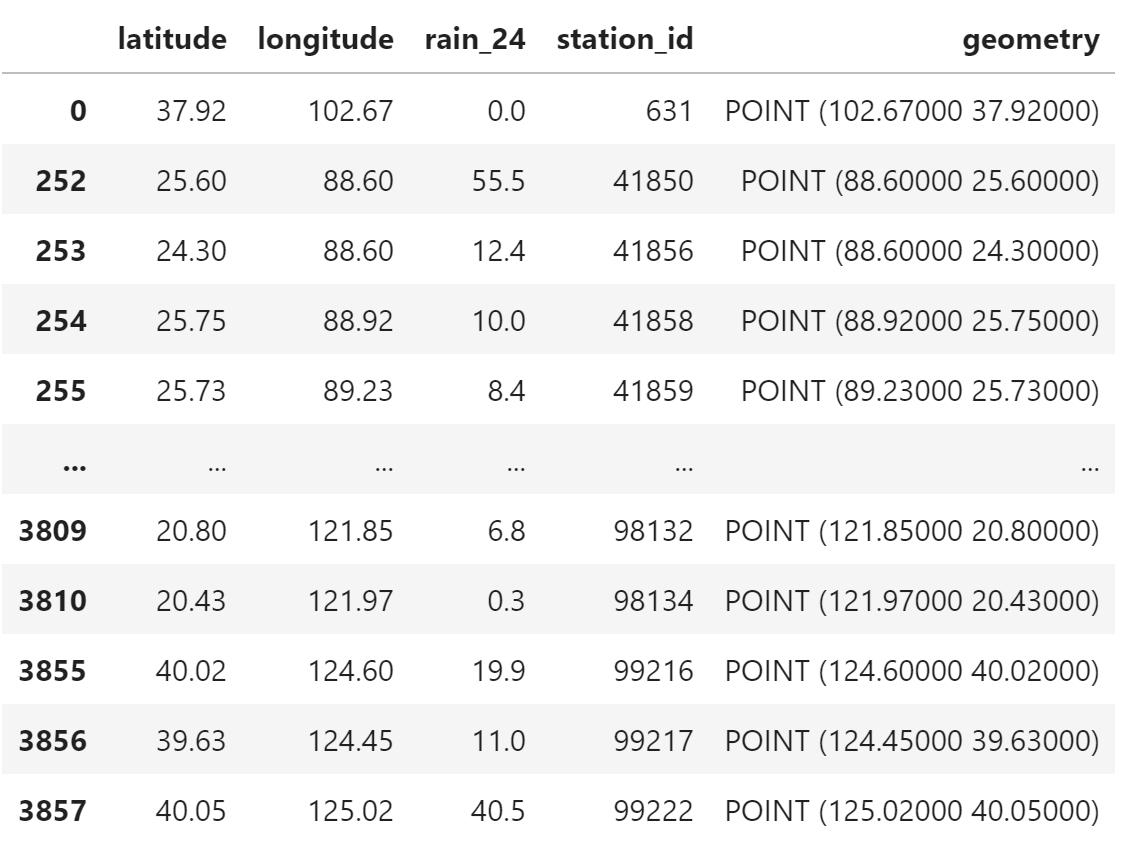
载入观测数据
obs_file = open(obs_rain_24, "r")
obs_file.readline()
obs_table = pd.read_csv(
    obs_file,
    sep="\s+",
    names=[
        "latitude",
        "longitude",
        "rain_24",
        "station_id",
    ]
)
obs_table
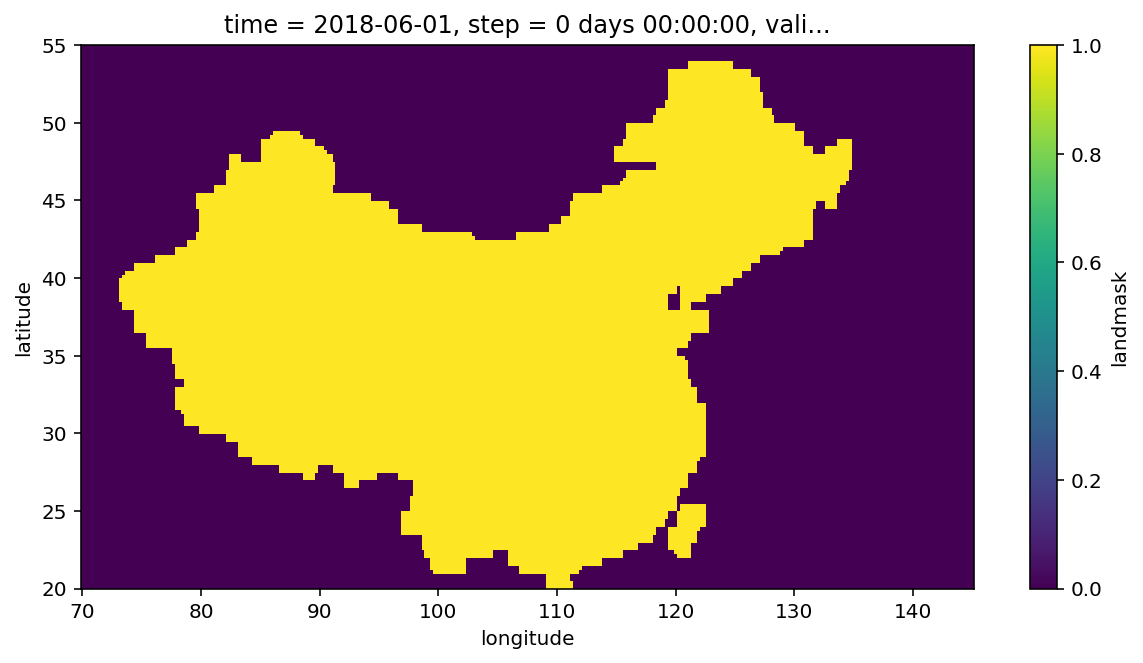
陆地掩码文件
已在 《计算地面要素场基本检验指标》 中介绍。
掩码文件路径
mask_file_path = "/base/run_grapes/landmask.grib"
载入掩码场
mask_field = load_field_from_file(
    mask_file_path,
)
mask_field.attrs["long_name"] = "landmask"
按区域范围绘制
mask_field.sel(
    latitude=slice(20, 55),
    longitude=slice(70, 145)
).plot(
    figsize=(10, 5)
)
plt.show()
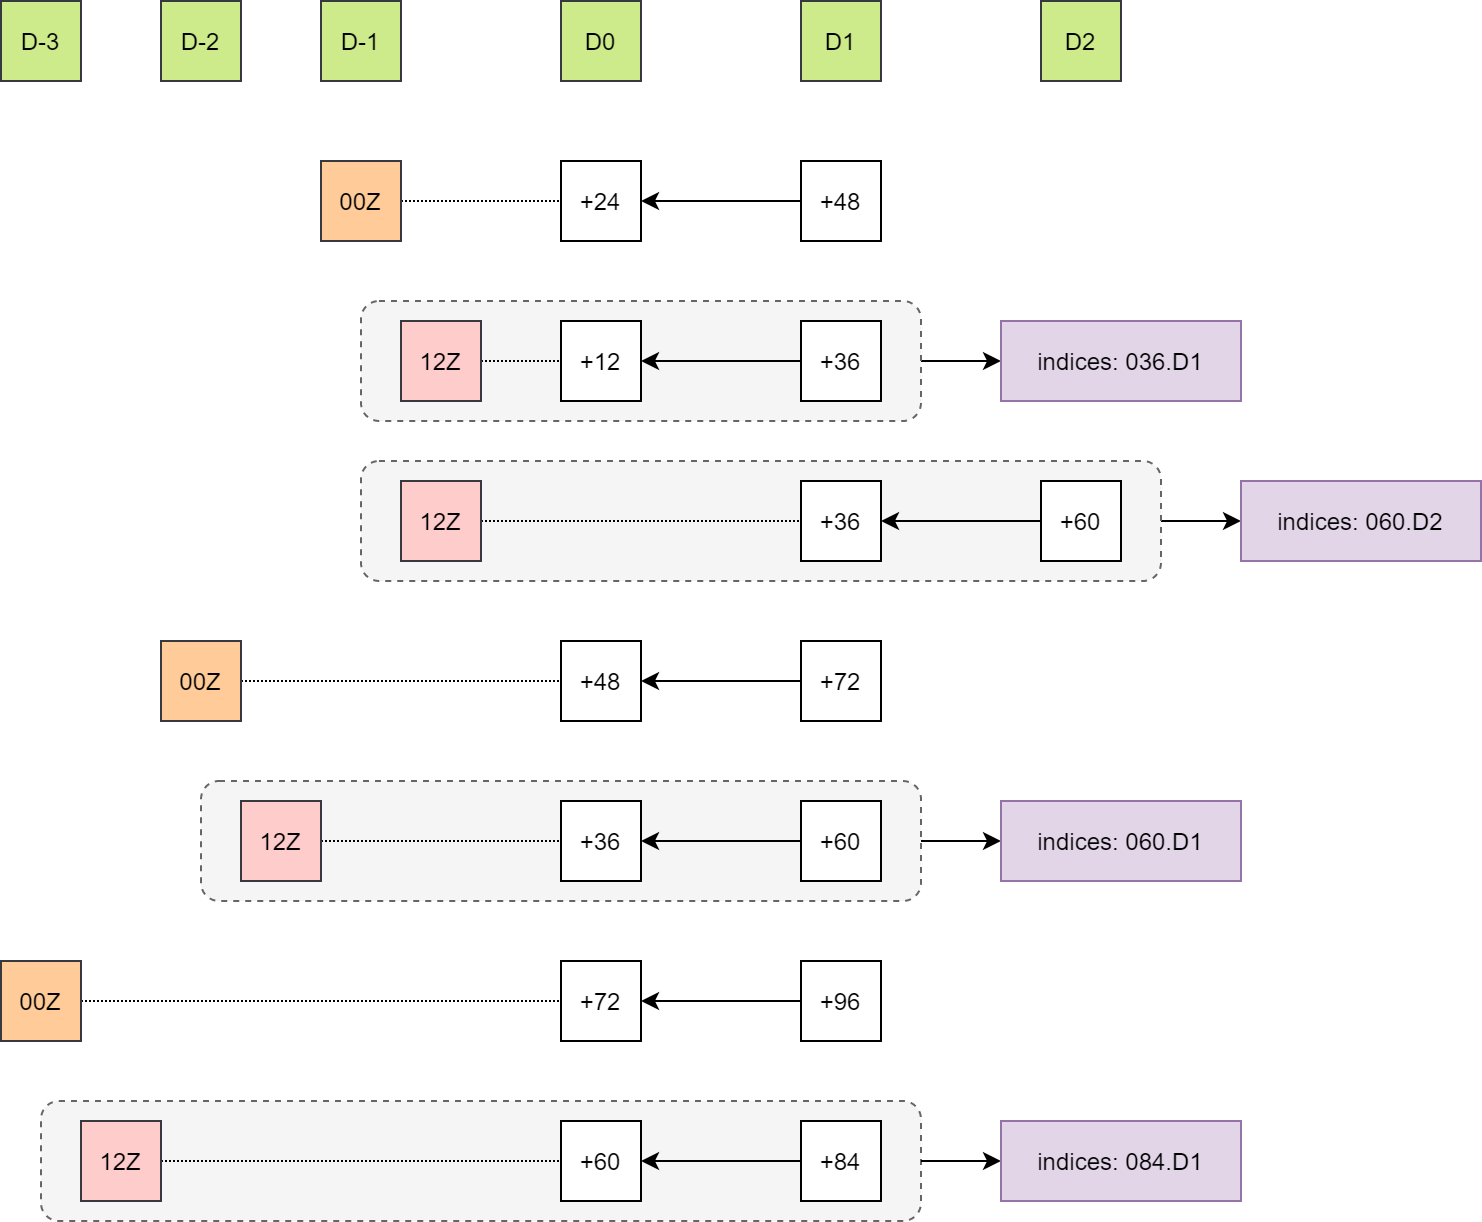
预报数据
下图说明预报场与观测场之间的关系,本文仅检验 00 点的 24 小时累积降水。
为了与 00 点对齐,12 时次第一个检验的时效是 036,036 的 24 小时降水由 036 - 012 计算得出。
对于 current_date 时刻 current_forecast_hour 时效预报所对应的起报时间
step_start_time = current_date - current_forecast_hour
step_start_time
Timestamp('2020-07-30 12:00:00')
即 036 时效是 2020-08-01 00 时次对应的起报时次是 2020-07-30 12 时次
加载 036 时效数据
forecast_036_path = pathlib.Path(
    forecast_root,
    f"rain{int(current_forecast_hour / pd.Timedelta(hours=1)):03d}.grapes.{step_start_time.strftime('%Y%m%d%H')}"
)
forecast_036_path
PosixPath('/base/run_grapes/ECMWF/rain036.grapes.2020073012')
!grib_ls {forecast_036_path}
/base/run_grapes/ECMWF/rain036.grapes.2020073012
edition      centre       typeOfLevel  level        dataDate     stepRange    shortName    packingType  gridType
1            kwbc         surface      0            20200730     36           tp           grid_simple  regular_ll
1 of 1 messages in /base/run_grapes/ECMWF/rain036.grapes.2020073012

1 of 1 total messages in 1 files
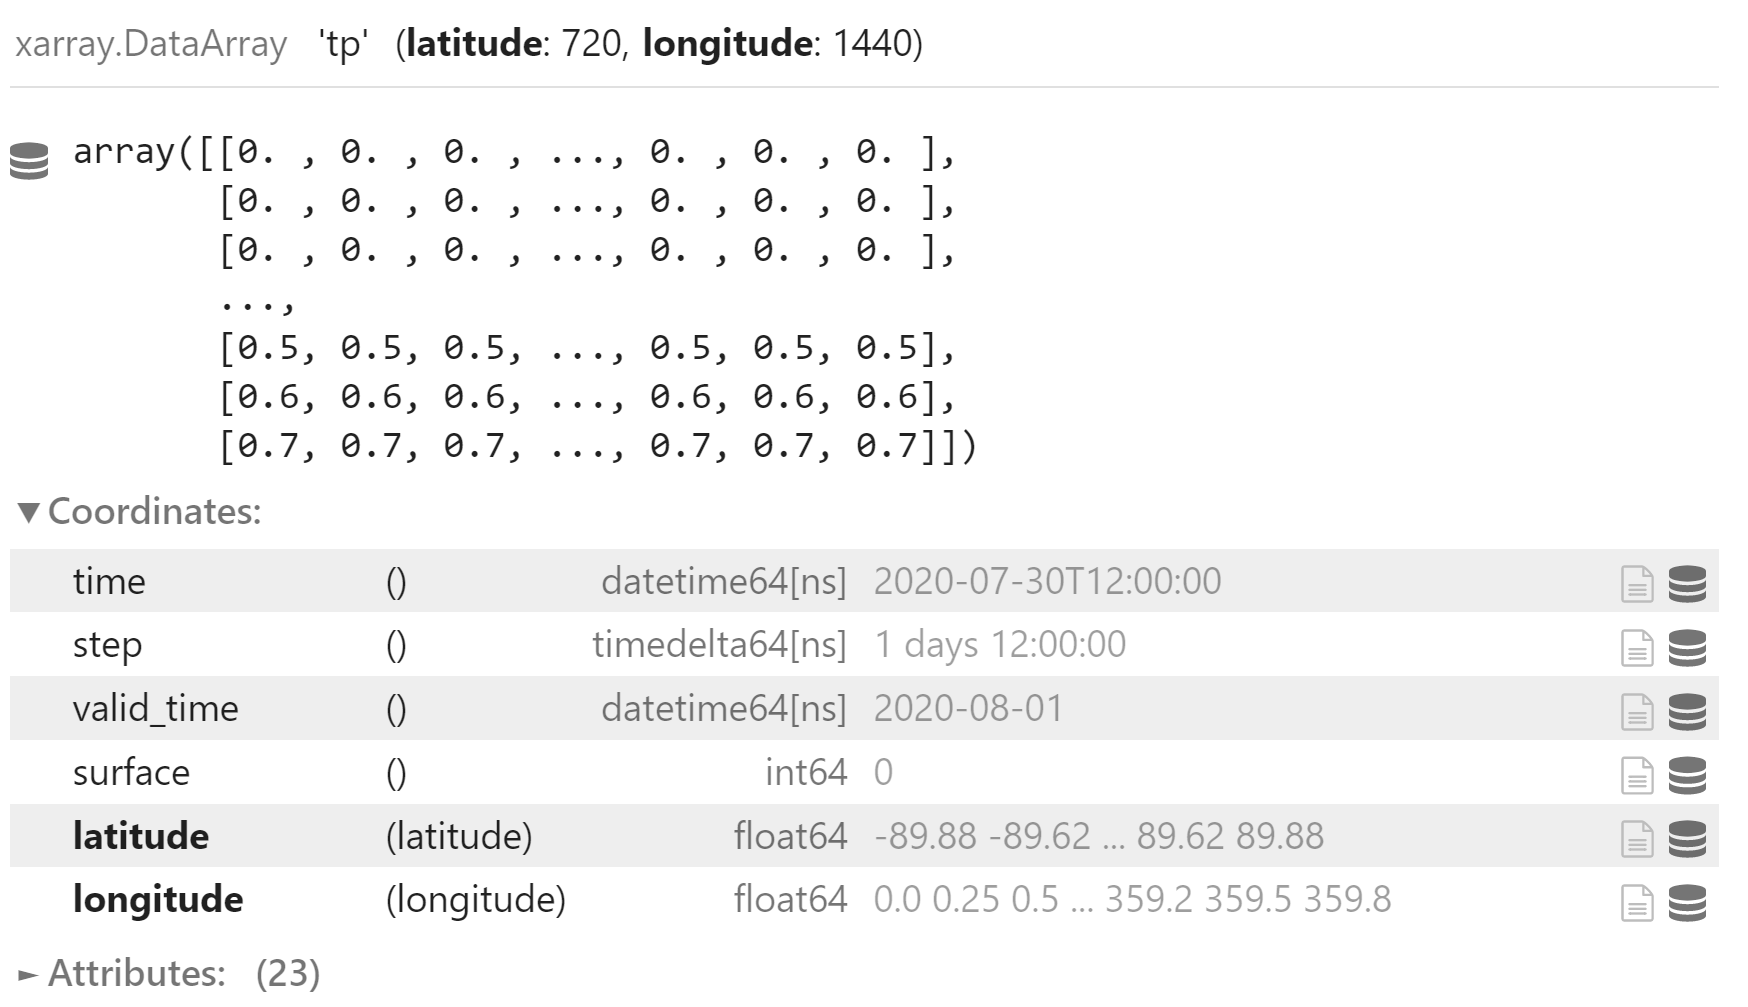
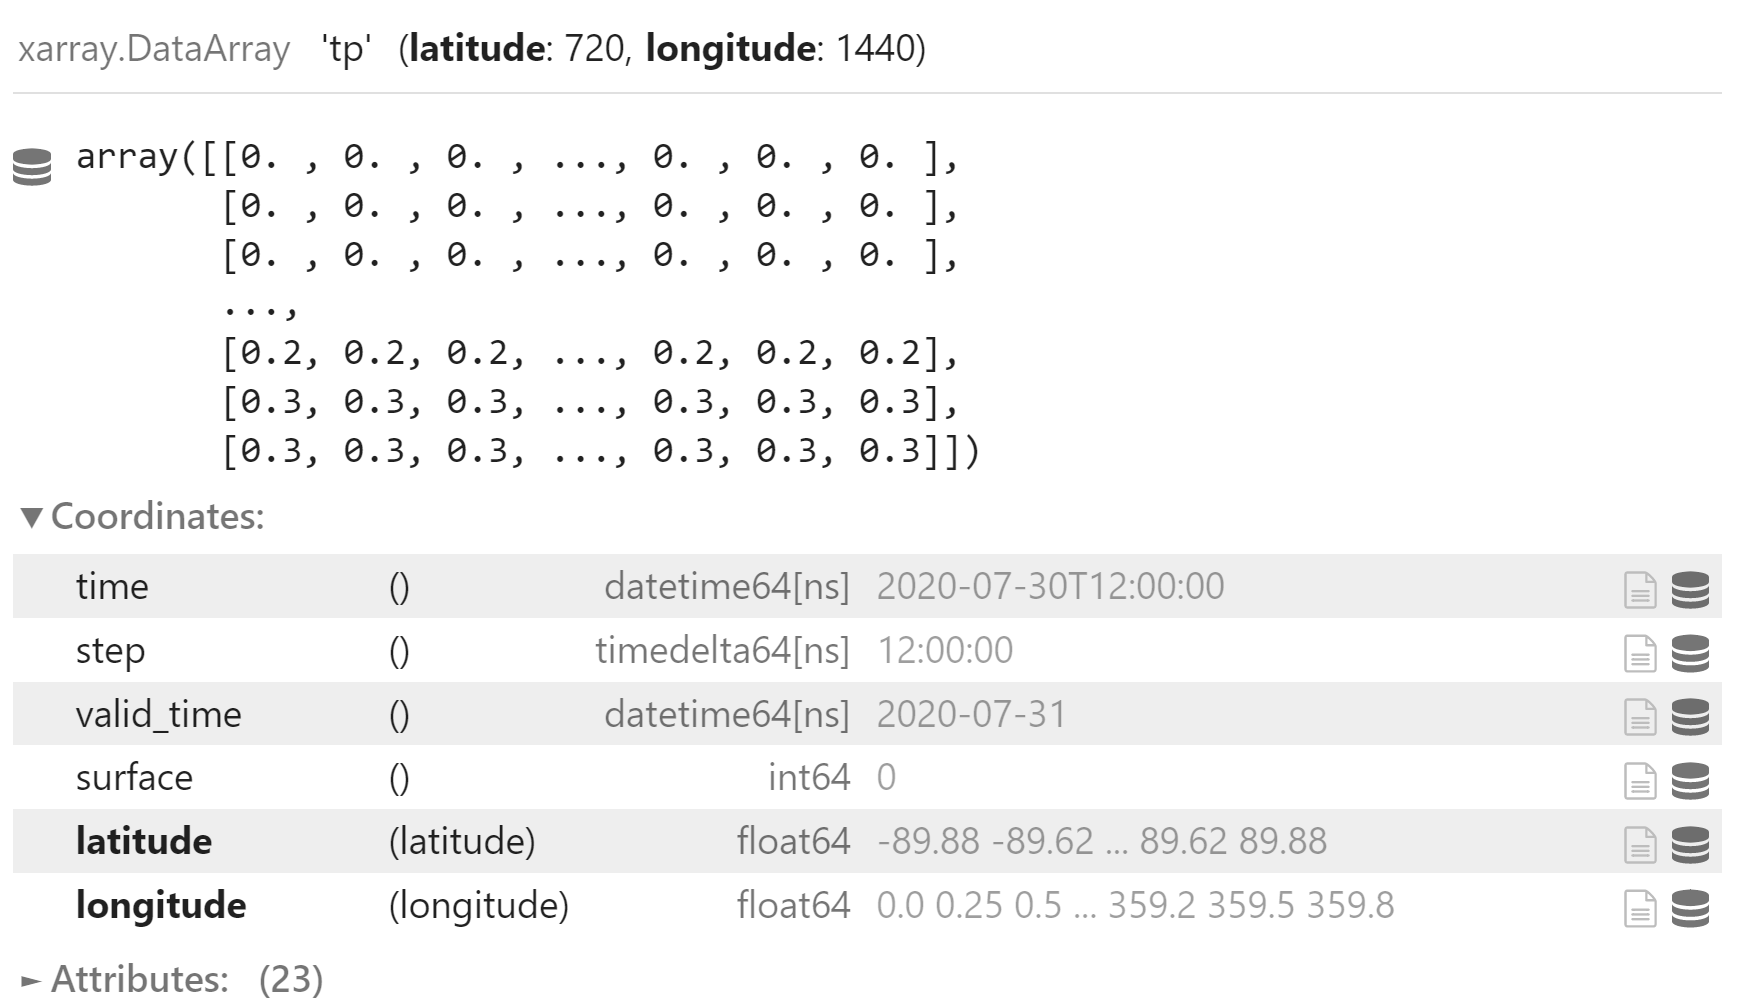
field_036 = load_field_from_file(
    forecast_036_path
)
field_036
加载 current_forecast_hour - 24 时效的数据,用于计算 24 小时累计降水
start_forecast_hour = current_forecast_hour - pd.Timedelta(hours=24)
forecast_012_path = pathlib.Path(
    forecast_root,
    f"rain{int(start_forecast_hour / pd.Timedelta(hours=1)):03d}.grapes.{step_start_time.strftime('%Y%m%d%H')}"
)
forecast_012_path
PosixPath('/base/run_grapes/ECMWF/rain012.grapes.2020073012')
field_012 = load_field_from_file(
    forecast_012_path
)
field_012
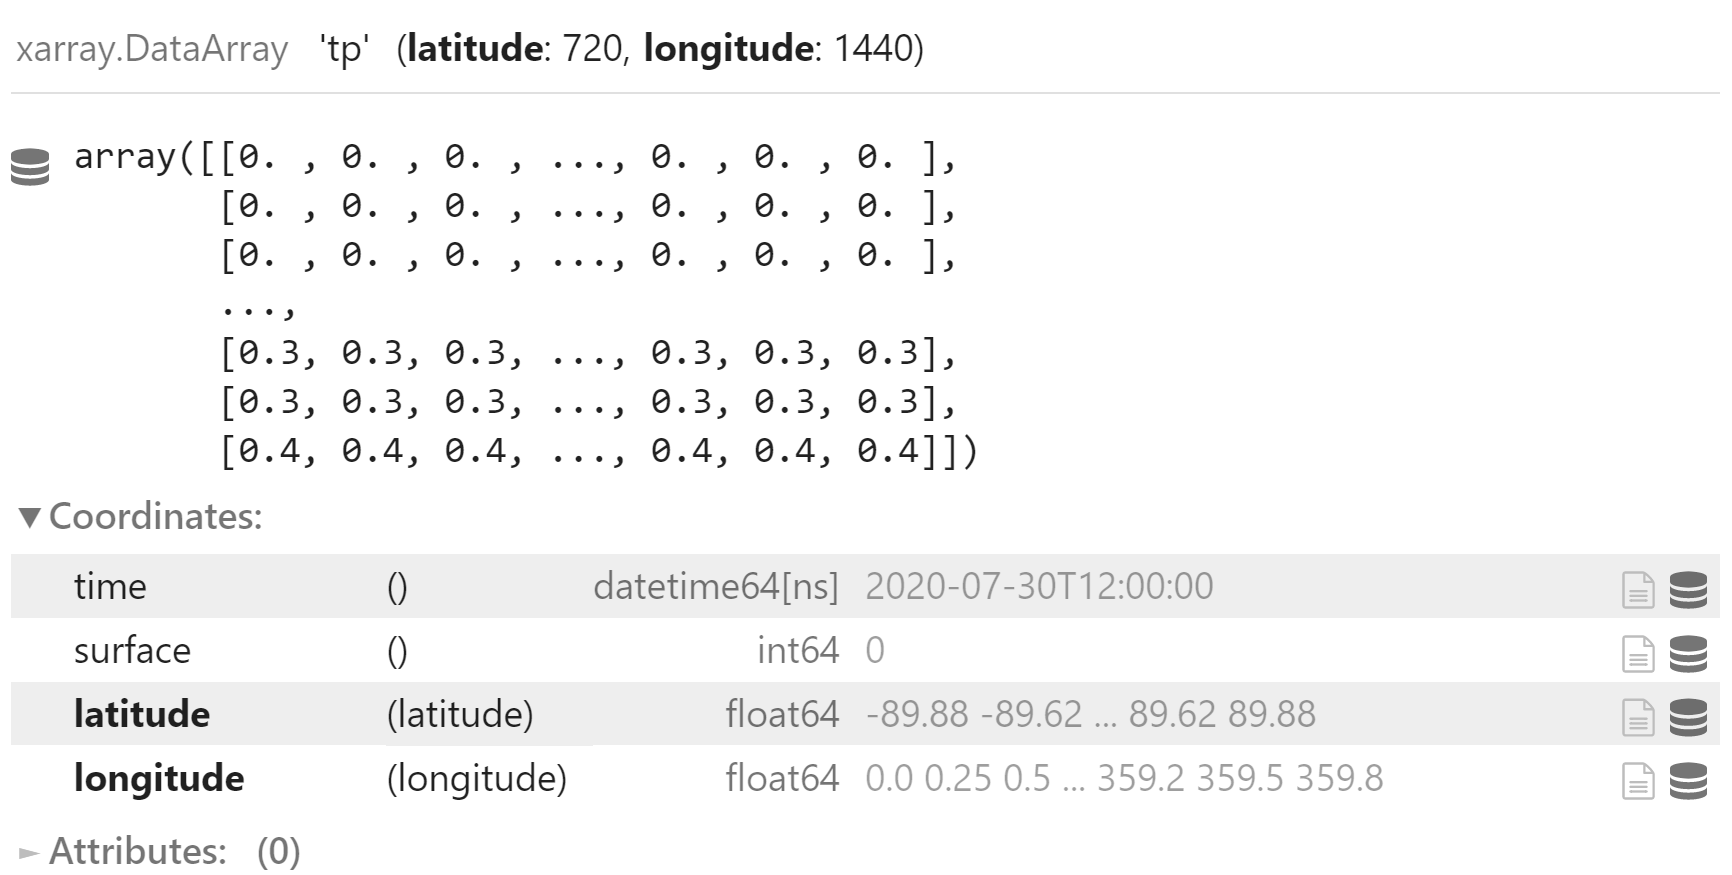
计算降水
field_rain = field_036 - field_012
field_rain
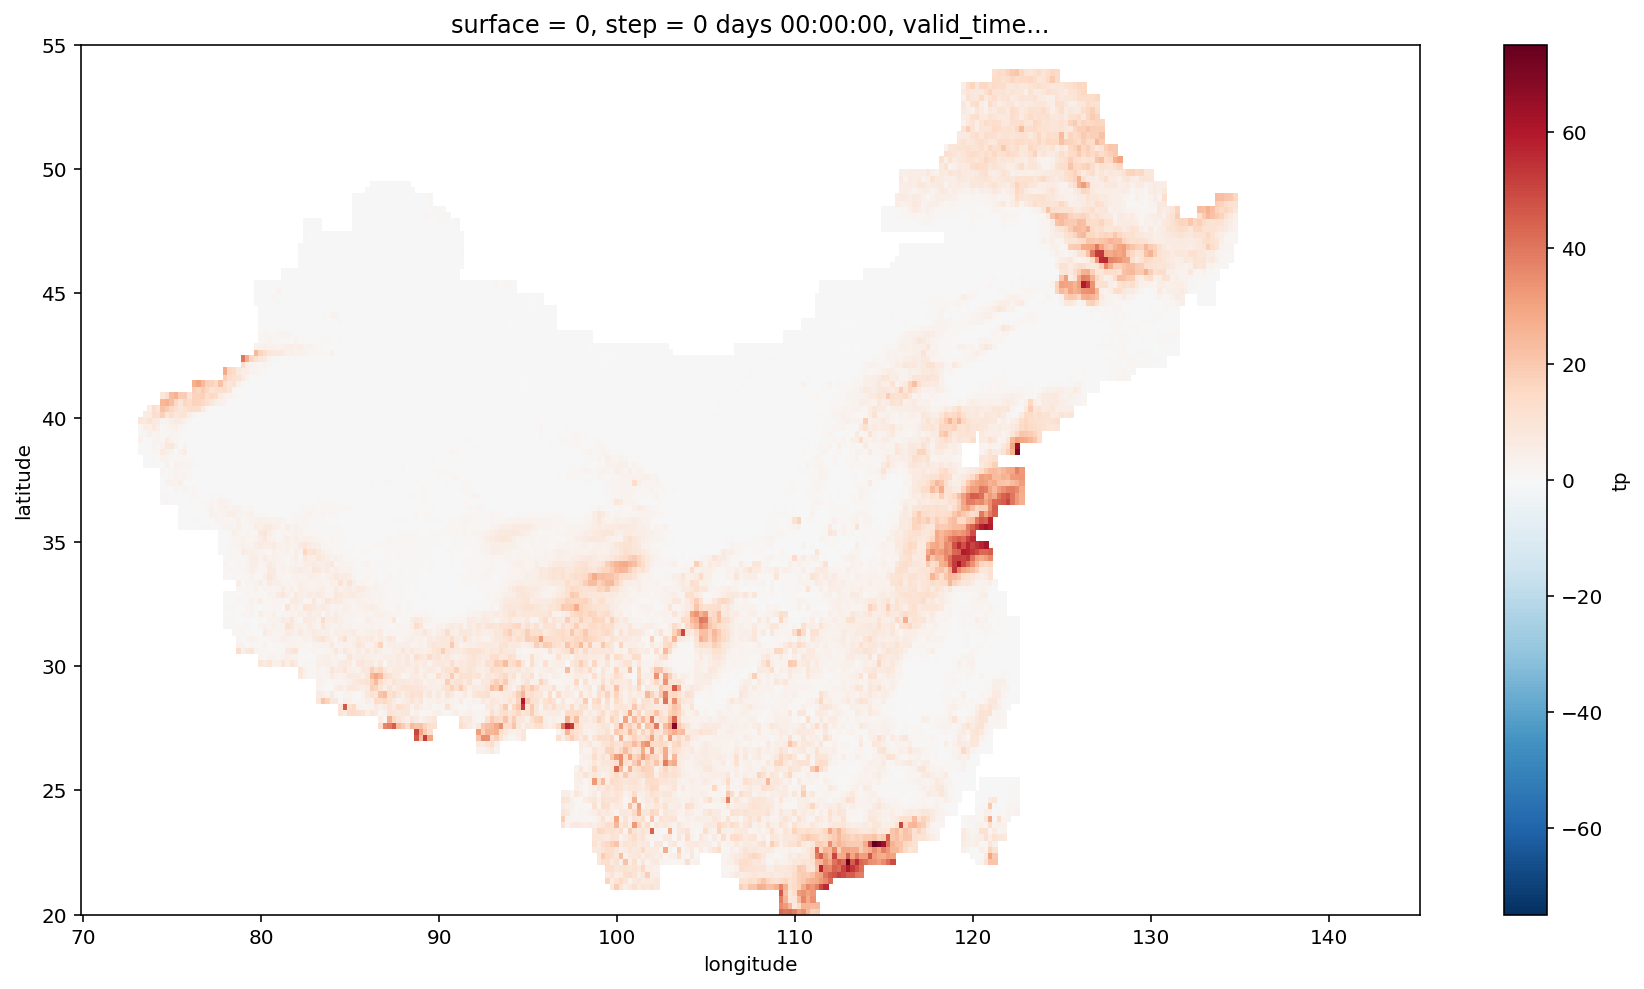
使用掩码处理
field_rain = field_rain.where(
    mask_field == 1
)
field_rain.sel(
    latitude=slice(20, 55),
    longitude=slice(70, 145)
).plot(
    figsize=(15, 8),
)
plt.show()
处理
与 《计算地面要素场基本检验指标》 中类似,提取 domain 区域范围内的站点观测数据。
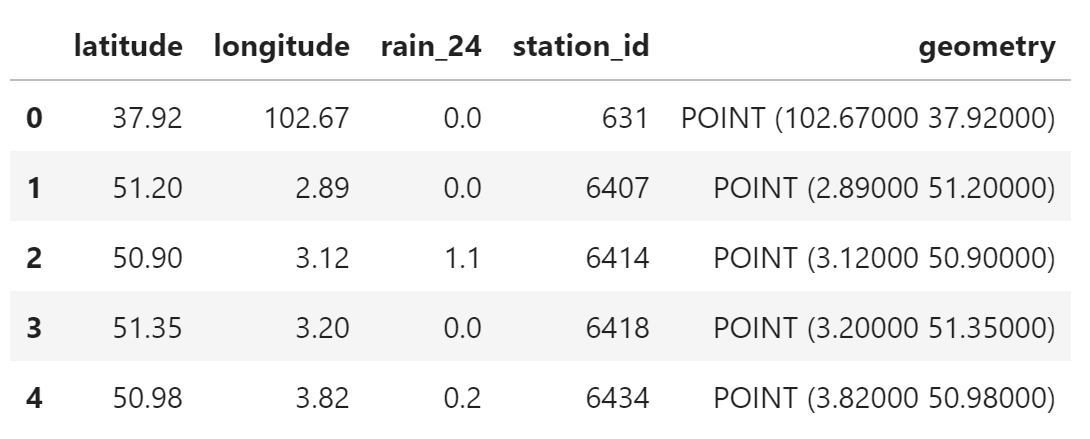
构建 geopandas.GeoDataFrame 对象
geo_obs_table = gpd.GeoDataFrame(
    obs_table,
    geometry=gpd.points_from_xy(
        obs_table.longitude,
        obs_table.latitude
    )
)
geo_obs_table.head()
选择区域范围内的观测站
polygen = Polygon([
    (70, 20),
    (70, 55),
    (145, 55),
    (145, 20),
])

area_rain_obs = geo_obs_table[geo_obs_table.intersects(polygen)].copy()
area_rain_obs
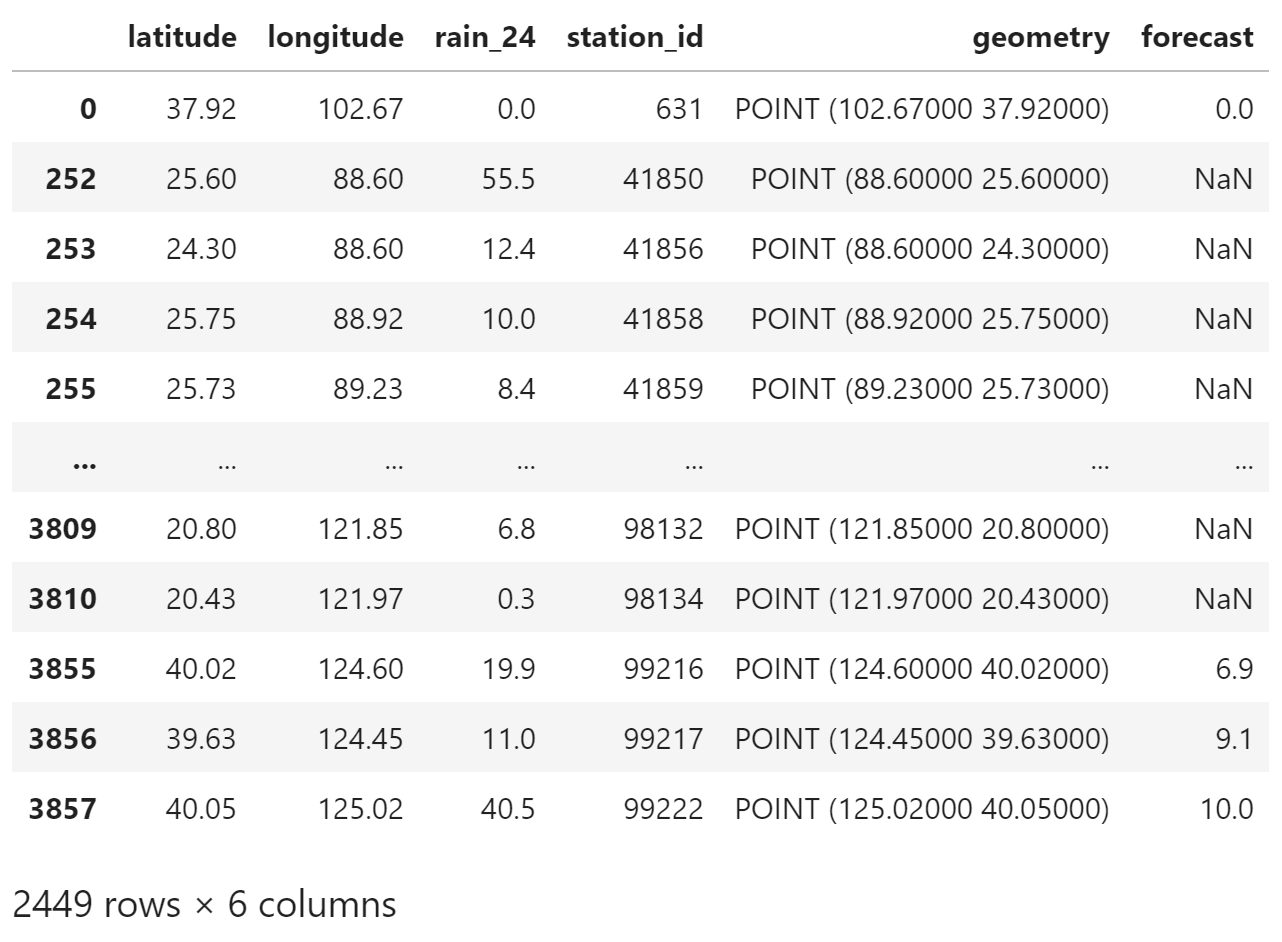
为每个观测站选择预报数据中的最近邻点
def get_forecast(row):
    value = field_rain.sel(
        longitude=row["longitude"],
        latitude=row["latitude"],
        method="nearest"
    ).item()
    return value

area_rain_obs["forecast"] = area_rain_obs.apply(
    get_forecast,
    axis="columns"
)
area_rain_obs
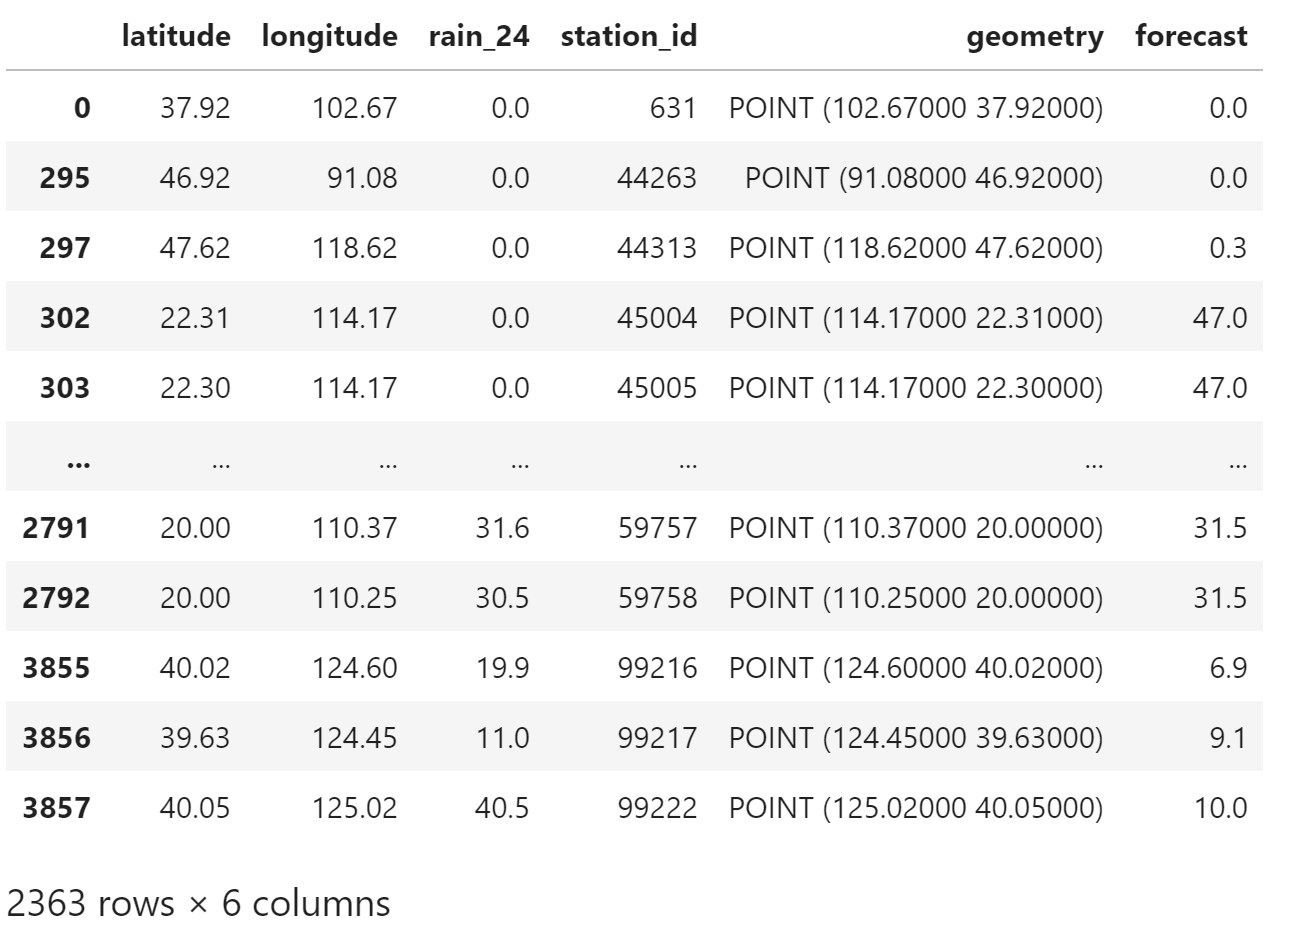
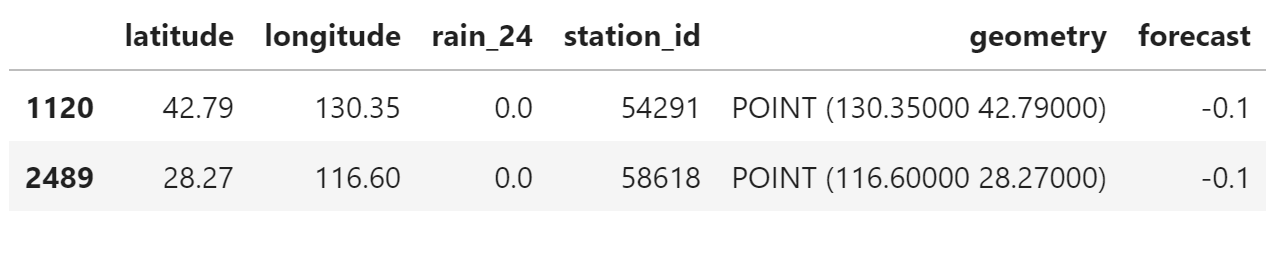
删掉预报值为 NaN 的条目,因为预报值使用了掩码。
df_area = area_rain_obs.dropna()
df_area
计算列联表
对于列联表,Meteva 的文档 有无预报检验 - 数值型检验指标 给出很好的说明。
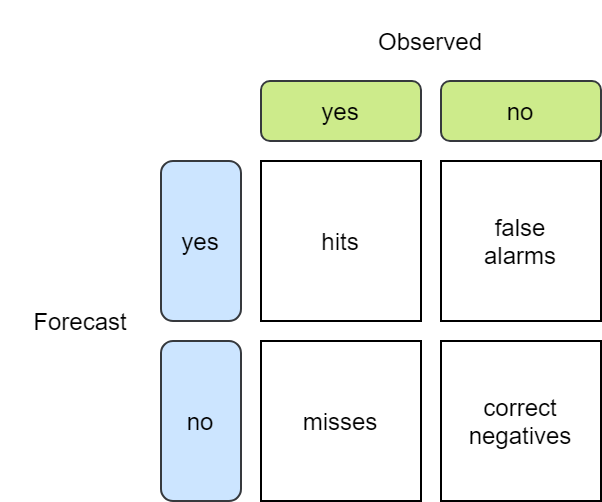
给定观测、预报和阈值,计算列联表四个元素的值
def calculate_matrix(obs, forecast, threshold):
    hits = 0
    false_alarms = 0
    misses = 0
    correct_negatives = 0
    if forecast >= threshold and obs >= threshold:
        hits = 1
    elif forecast >= threshold and 0 <= obs <= threshold:
        false_alarms = 1
    elif 0 <= forecast <= threshold and obs >= threshold:
        misses = 1
    elif 0 <= forecast <= threshold and 0 <= obs <= threshold:
        correct_negatives = 1
    return (hits, false_alarms, misses, correct_negatives)
计算 0.1 mm 阈值的列联表
threshold = 0.1
matrix_values_0p1 = [
    calculate_matrix(
        obs,
        forecast,
        threshold=threshold,
    )
    for (
        obs,
        forecast
    )
    in zip(
        df_area["rain_24"],
        df_area["forecast"]
    )
]
matrix = np.array(matrix_values_0p1)
matrix
array([[0, 0, 0, 1],
       [0, 0, 0, 1],
       [0, 1, 0, 0],
       ...,
       [1, 0, 0, 0],
       [1, 0, 0, 0],
       [1, 0, 0, 0]])
matrix.sum(axis=0)
array([1108, 962, 24, 267])
计算所有阈值的列联表
rows = []
for threshold in thresholds:
    matrix_values_0p1 = [
        calculate_matrix(
            obs,
            forecast,
            threshold=threshold,
        )
        for (
            obs,
            forecast
        )
        in zip(
            df_area["rain_24"],
            df_area["forecast"]
        )
    ]
    matrix = np.array(matrix_values_0p1)
    row = matrix.sum(axis=0)
    rows.append(row)
df_matrix = pd.DataFrame(
    rows,
    columns=[
        "hits",
        "false_alarms",
        "misses",
        "correct_negatives",
    ],
)
df_matrix["threshold"] = thresholds
验证
对比计算结果
已有计算结果是:
           AA      BB     CC      DD
0.1  mm     1108    962     24    267
  1  mm      777    828     54    702
  5  mm      335    475    166   1385
 10  mm      144    242    176   1799
 25  mm       18     67     91   2185
 50  mm        0      8     33   2320
100  mm        0      0      4   2357
本文计算的结果:
df_matrix
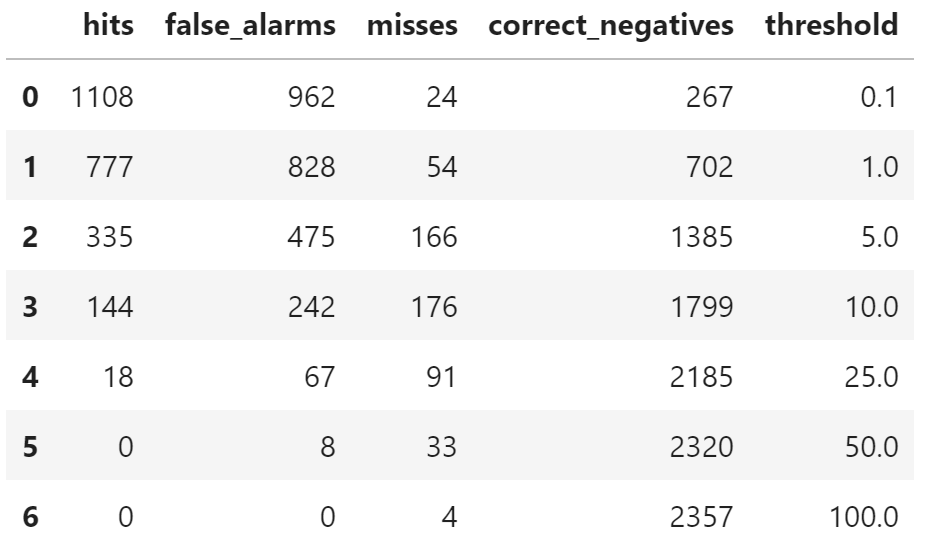
与已有结果保持一致
统计样本个数
df_matrix[["hits", "false_alarms", "misses", "correct_negatives"]].sum(axis="columns")
0    2361
1    2361
2    2361
3    2361
4    2361
5    2361
6    2361
dtype: int64
与 df_area 的行数 (2363) 不一致,因为 df_area 中有两行观测数据小于 0,在计算中被忽略。
注:笔者不清楚为什么会有负数出现。
df_area[df_area["forecast"] < 0.0]
参考
https://www.cawcr.gov.au/projects/verification/
模式检验系列文章
等压面要素场
地面要素场
