产品生成时间聚类
本文属于介绍 NWPC 消息平台 系列文章。
数值预报业务系统运维的终极目标之一就是保障产品的按时分发。 这就涉及到如何界定产品生成时间是否正常,使用什么样的标准来判断产品生成时间延迟。 目前我们在实践中通常使用一个固定的时间阈值。 但为了获取更精确的提供产品服务的时间,需要对历史数据进行统计分析。
本文尝试采用聚类方法来判断产品生成是否延迟。 下面使用两种方法对产品生成时间进行聚类,对比不同聚类数目的分类结果。
数据
使用 NWPC 消息平台中 2020 年 10 月 1 日至 2021 年 3 月 31 日 GRAPES MESO 3KM 系统 036h 时效原始分辨率 GRIB2 数据的产品生成事件消息。
使用 nwpc-oper/nwpc-message-tool 库从 ElasticSearch 中检索并保存成 CSV 文件。
使用 R 语言 read.csv() 函数加载后数据类似:
           system stream  type name start_time forecast_hour
1 grapes_meso_3km   oper grib2 orig 2020-10-01            36
2 grapes_meso_3km   oper grib2 orig 2020-10-02            36
3 grapes_meso_3km   oper grib2 orig 2020-10-03            36
4 grapes_meso_3km   oper grib2 orig 2020-10-04            36
5 grapes_meso_3km   oper grib2 orig 2020-10-05            36
6 grapes_meso_3km   oper grib2 orig 2020-10-06            36
                 time   event   status
1 2020-10-01 05:40:34 storage Complete
2 2020-10-02 05:35:50 storage Complete
3 2020-10-03 05:34:55 storage Complete
4 2020-10-04 05:39:35 storage Complete
5 2020-10-05 06:57:51 storage Complete
6 2020-10-06 05:39:47 storage Complete
对数据进行处理,计算产品生成时间 time 与起报时次 start_time 的时间差值,结果如下所示
  start_time                time          clock clock_min
1 2020-10-01 2020-10-01 05:40:34 5.676111 hours  340.5667
2 2020-10-02 2020-10-02 05:35:50 5.597222 hours  335.8333
3 2020-10-03 2020-10-03 05:34:55 5.581944 hours  334.9167
4 2020-10-04 2020-10-04 05:39:35 5.659722 hours  339.5833
5 2020-10-05 2020-10-05 06:57:51 6.964167 hours  417.8500
6 2020-10-06 2020-10-06 05:39:47 5.663056 hours  339.7833
其中 clock_min 是将时间差值转换为分钟数,是聚类的对象。
绘图
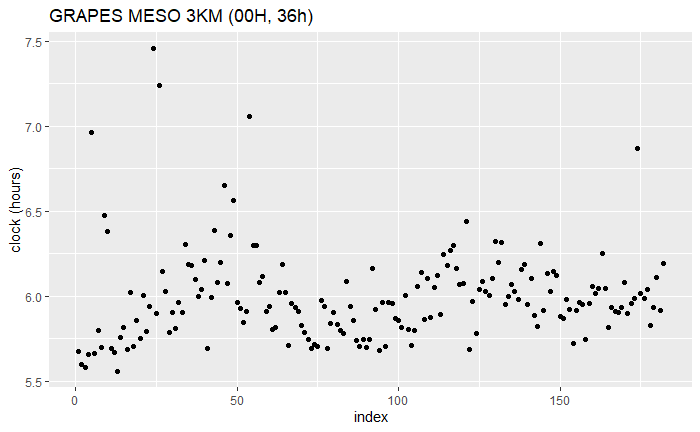
数据散点图
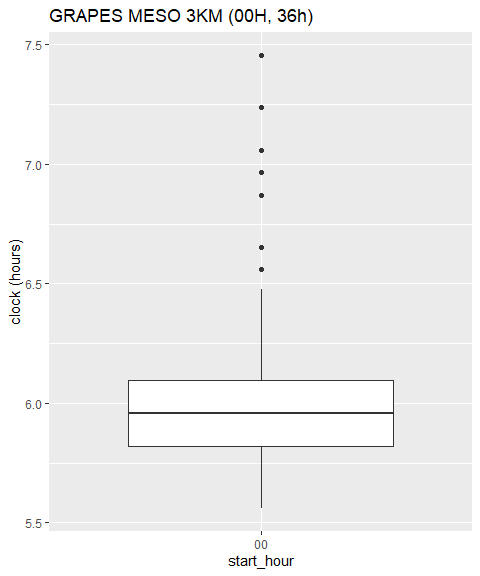
箱线图
方法
最直观的分类个数是 2 类:
- 产品生成正常
- 产品生成延迟
也可以分为 3 类:
- 产品生成正常
- 产品比正常情况略有延迟,但无需报警
- 产品生成延迟,需要报警
最多分为 4 类:
- 产品生成正常
- 产品比正常情况略有延迟,但无需报警
- 产品生成延迟,需要报警
- 产品生成异常延迟,需要报警,属于异常点
笔者认为更多的分类很难给出合理的解释。
因此,本文使用 K 均值聚类和 PAM 聚类两种方法,将数据分为 2/3/4 类。
K 均值聚类使用 R 语言自带的 kmeans() 函数,PAM 聚类使用 cluster 包的 pam() 函数
结果
k=2
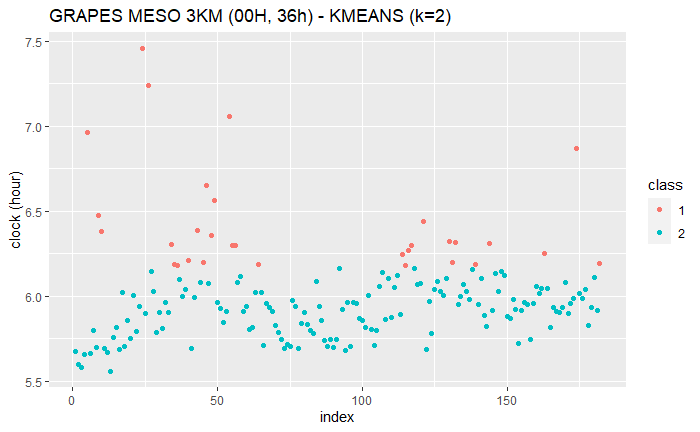
KMAENS (k=2)
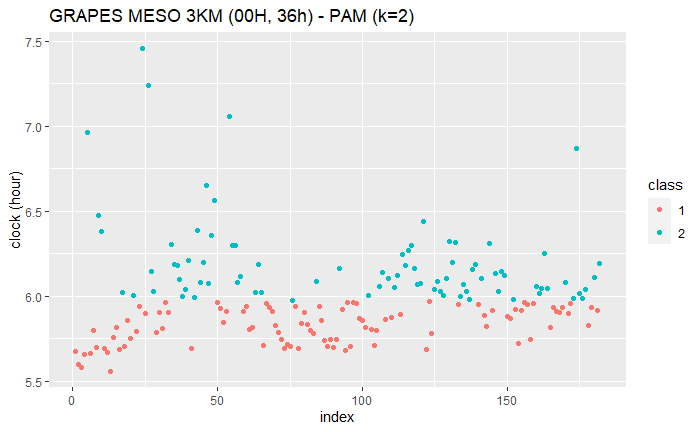
PAM (k=2)
k=3
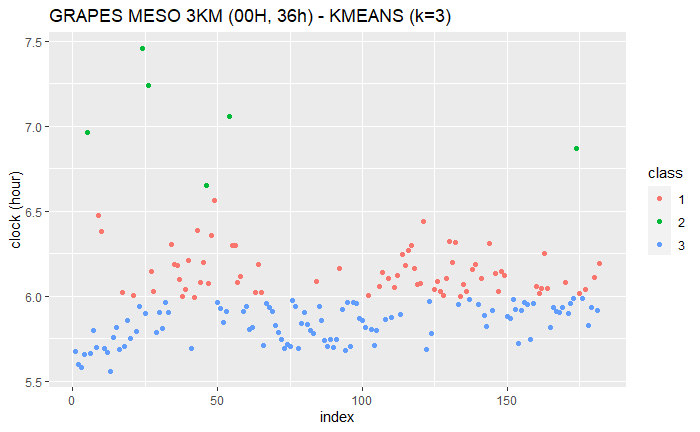
KMAENS (k=3)
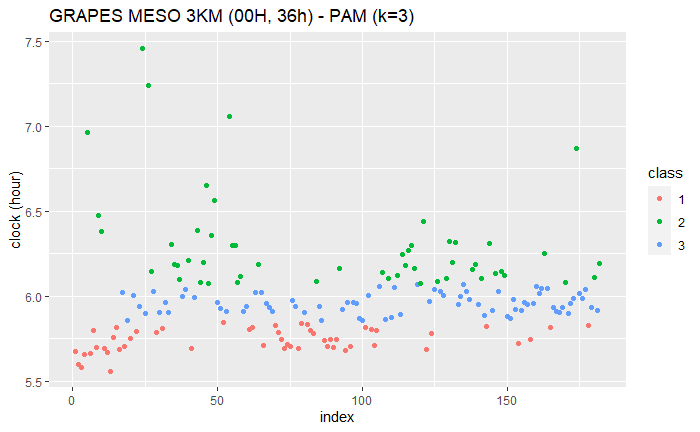
PAM (k=3)
k=4
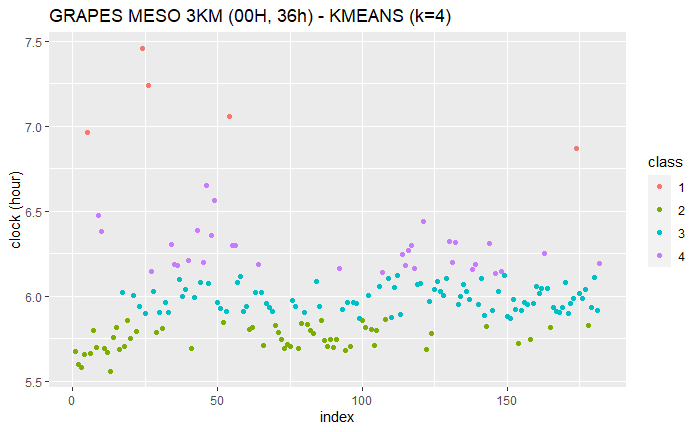
KMAENS (k=4)
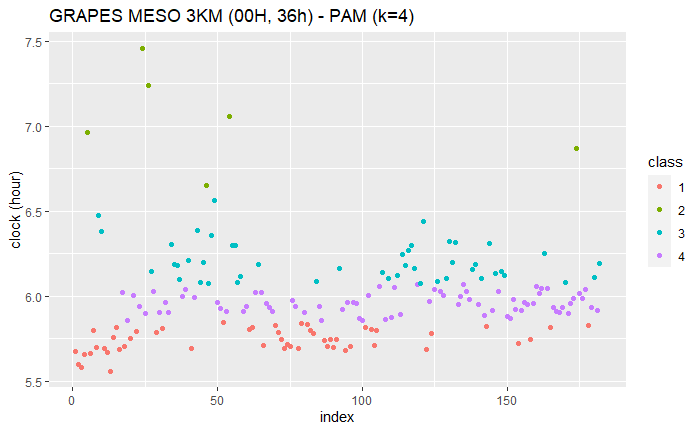
PAM (k=4)
实现
library(NbClust)
library(ggplot2)
library(cluster)
library(lubridate)
数据
加载数据,选择需要的列
meso_3km <- read.csv("data/grapes_meso_3km.csv", header=TRUE)
meso_3km$start_time <- ymd_hms(meso_3km$start_time)
meso_3km$time <- ymd_hms(meso_3km$time)
production_df <- meso_3km[c("start_time", "time")]
处理数据
production_df$clock <- production_df$time - production_df$start_time
production_df$clock_min <- as.numeric(production_df$clock, units="mins")
绘图
散点图
ggplot(production_df, aes(y = clock, x=1:nrow(production_df))) +
  geom_point() +
  labs(
    title="GRAPES MESO 3KM (00H, 36h)",
    x="index",
    y="clock (hours)"
    )
箱线图
ggplot(production_df, aes(y = clock, x="00")) +
  geom_boxplot() +
  labs(
    title="GRAPES MESO 3KM (00H, 36h)",
    x="start_hour",
    y="clock (hours)"
    )
用于绘制聚类结果的函数
plot_cluster <- function(title, clustering, df=production_df) {
  ggplot(
    df,
    aes(
      x = 1:nrow(df),
      y = clock,
      color=as.factor(clustering)
    )
  ) +
    geom_point() +
    labs(
      title=title,
      x="index",
      y="clock (hour)",
      color="class"
    )
}
K 均值
使用 NbClust() 函数辅助判断最佳聚类数目
nc <- NbClust(
  production_df["clock_min"],
  min.nc=2,
  max.nc=10,
  method="kmeans"
)
聚类,输出聚类中心
fit_kmeans_4 <- kmeans(production_df["clock_min"], 4)
fit_kmeans_4$centers
绘制聚类结果
plot_cluster("GRAPES MESO 3KM (00H, 36h) - KMEANS (k=4)", fit_kmeans_4$cluster)
PAM
聚类,输出聚类中心
fit_pam_2 <- pam(production_df["clock_min"], k=2, stand=TRUE)
fit_pam_2$medoids
绘制聚类结果
plot_cluster("GRAPES MESO 3KM (00H, 36h) - PAM (k=2)", fit_pam_2$clustering)
参考
另一种判断产品生成时间是否超时的方法:
NWPC 消息平台项目
