Matplotlib绘制双坐标轴
目录
本文以绘制垂直廓线图为例说明在 Matplotlib 中如何在左右坐标轴上绘制不同的坐标。
准备
载入需要的库
import matplotlib.pyplot as plt
import numpy as np

from nwpc_data.grib.eccodes import load_field_from_file
from nwpc_data.data_finder import find_local_file
数据
本文绘制 GRAPES GFS 模式 2020 年 10 月 18 日 00 时次 105 时效北纬 40 度的平均垂直廓线图。
查找数据文件路径
file_path = find_local_file(
    "grapes_gfs_gmf/grib2/orig",
    start_time="2020101800",
    forecast_time="105h",
)
载入所有等压面层的温度场
short_name = "t"
level_type = "pl"
field = load_field_from_file(
    file_path=file_path,
    parameter=short_name,
    level_type=level_type,
)
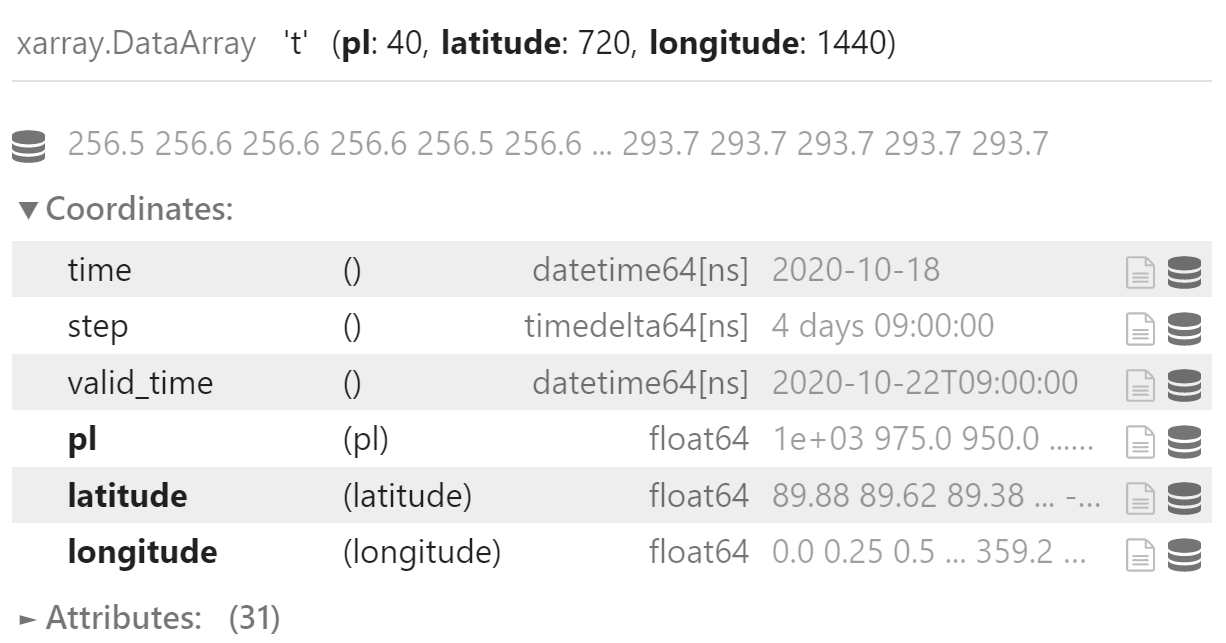
field
提取北纬 40 度从 1000 hPa 到 20 hPa 的数据
data = field.sel(
    pl=slice(1000, 20)
).sel(
    latitude=40,
    method="nearest",
)
data
计算均值
mean_data = data.mean(dim="longitude")
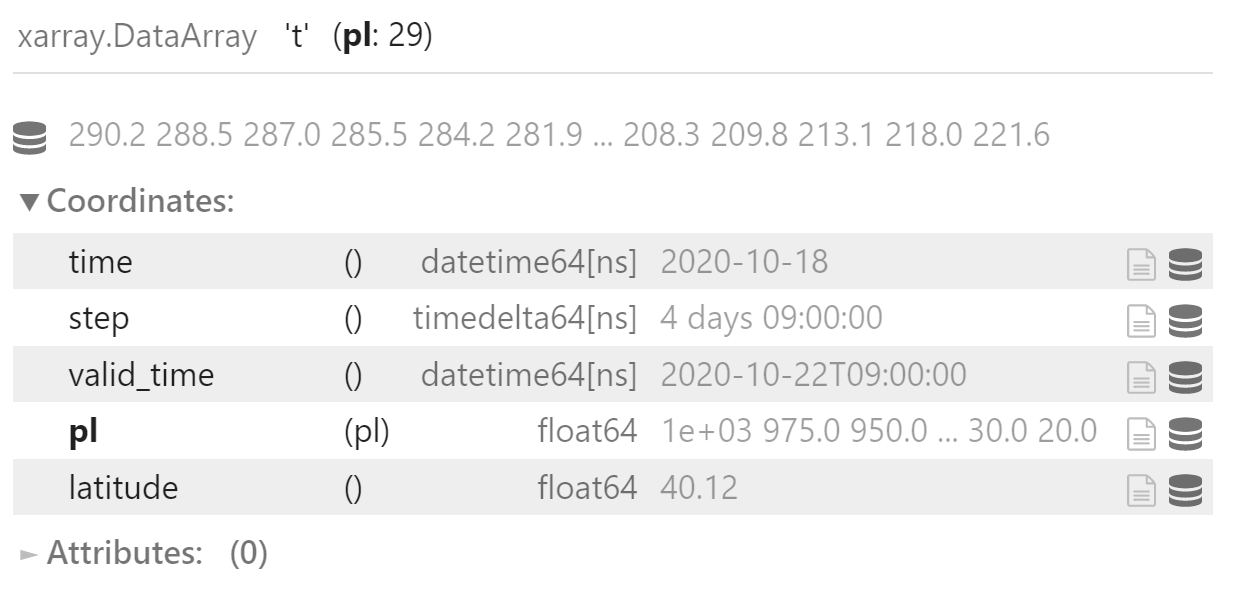
mean_data
绘制第一个坐标
构造层次列表
level_nos = np.arange(1, len(mean_data.pl) + 1)
level_nos
array([ 1, 2, 3, 4, 5, 6, 7, 8, 9, 10, 11, 12, 13, 14, 15, 16, 17,
18, 19, 20, 21, 22, 23, 24, 25, 26, 27, 28, 29])
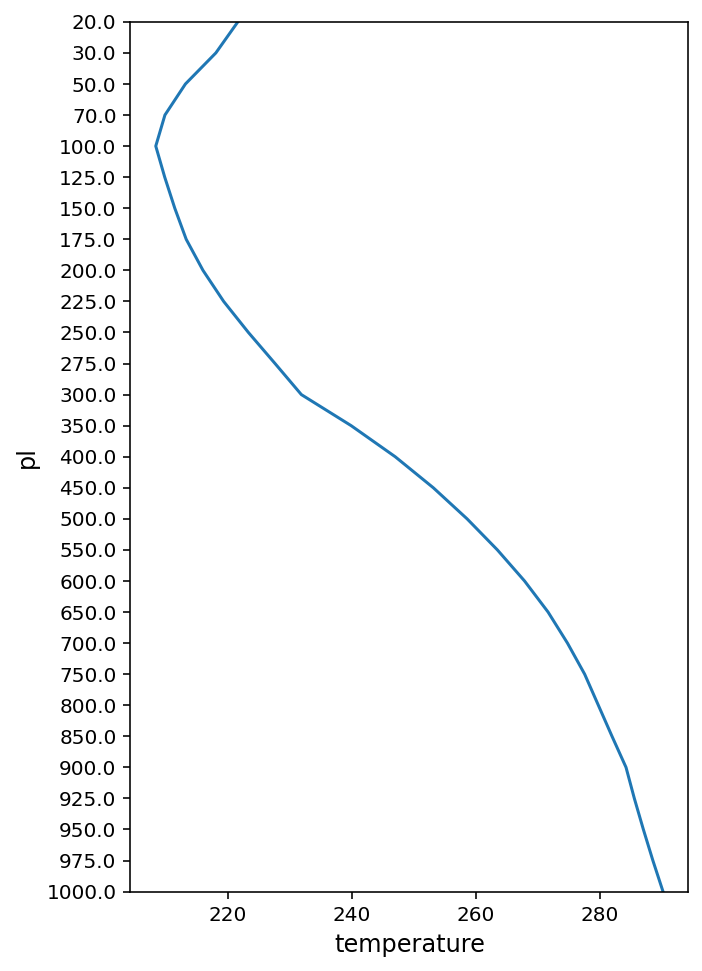
绘制廓线图,在左坐标轴上绘制气压值作为 Y 轴坐标
fig, ax = plt.subplots(figsize=(5, 8))
ax.plot(mean_data.values, level_nos)

ax.invert_yaxis()
ax.set_ylim(level_nos[0], level_nos[-1])
ax.set_yticks(level_nos)
ax.set_yticklabels(mean_data.pl.values)
ax.set_ylabel("pl", fontsize=12)

ax.set_xlabel("temperature", fontsize=12)

plt.show()
绘制第二个坐标
将层次列表绘制在右坐标轴上
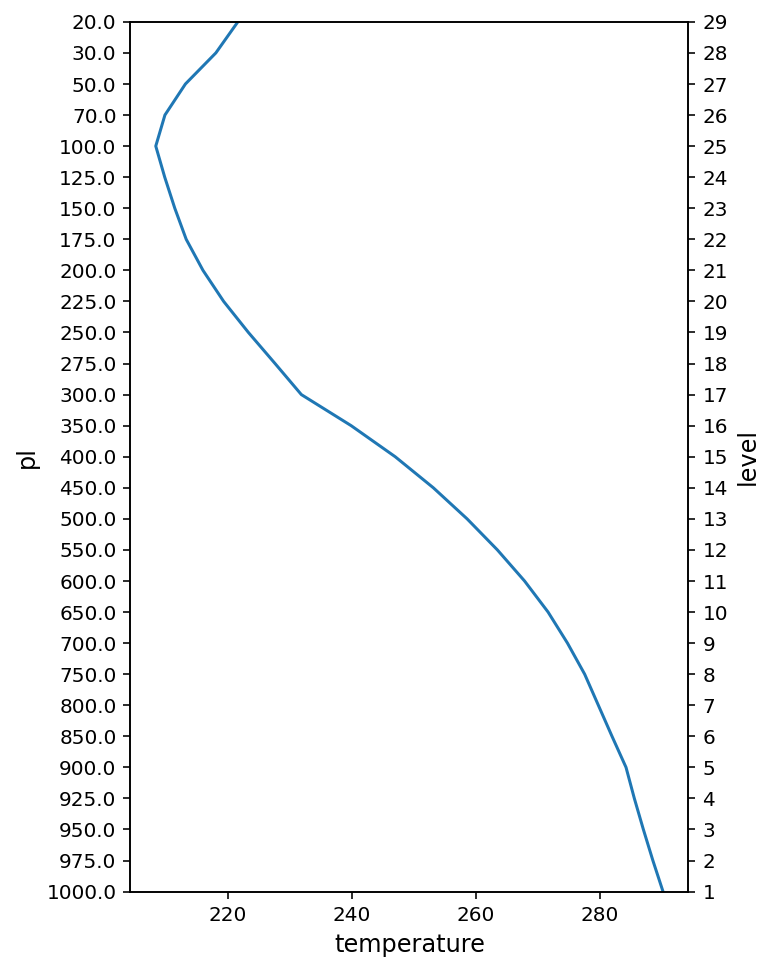
使用 ax2 = ax.twinx() 创建与上图共享 X 轴的新图形,只绘制 Y 坐标。
fig, ax = plt.subplots(figsize=(5, 8))

ax.invert_yaxis()
ax.plot(mean_data.values, level_nos)
ax.set_ylim(level_nos[0], level_nos[-1])
ax.set_yticks(level_nos)
ax.set_yticklabels(mean_data.pl.values)
ax.set_ylabel("pl", fontsize=12)

ax.set_xlabel("temperature", fontsize=12)

ax2 = ax.twinx()
ax2.set_yticks(level_nos)
ax2.set_ylim(level_nos[0], level_nos[-1])
ax2.set_yticklabels(level_nos)
ax2.set_ylabel("level", fontsize=12)

plt.show()
本文没有使用对数坐标轴,后续有待改进。
参考
https://stackoverflow.com/questions/14762181/adding-a-y-axis-label-to-secondary-y-axis-in-matplotlib
