Meteva笔记:计算格点降水的列联表
Meteva 是由 nmc 开源的全流程检验程序库,提供了常用的各种气象预报检验评估的算法函数,气象检验分析的图片和表格型产品的制作函数,以及检验评估系统示例。
本文以 24 小时累积降水为例,说明如何计算格点场二分类预报的列联表。 同时会介绍如何使用 Meteva 计算列联表。
准备
载入需要使用到的库
import numpy as np
import pandas as pd
import xarray as xr

import matplotlib.pyplot as plt

import pathlib

from nwpc_data.grib.eccodes import load_field_from_file
from nwpc_data.data_finder import find_local_file
参数
区域范围,仅计算区域内的观测
domain = [20, 55, 70, 145]降水阈值,单位为 mm。为每个阈值分别计算列联表
thresholds = [0.1, 1, 5, 10, 25, 50, 100]观测时刻,2020 年 8 月 1 日 00 时次
current_date = pd.to_datetime("2020-08-01 00:00:00")选择 12 时次预报
current_start_hour = pd.Timedelta(hours=12)数据目录
forecast_root = "/g2/nwp_vfy/operation/EC"数据
预报
对于 current_date 时刻 current_forecast_hour 时效预报所对应的起报时间
step_start_time = current_date - current_forecast_hour
step_start_time
Timestamp('2020-07-30 12:00:00')
即 036 时效是 2020-08-01 00 时次对应的起报时次是 2020-07-30 12 时次
加载 036 时效数据
forecast_036_path = pathlib.Path(
    forecast_root,
    f"rain{int(current_forecast_hour / pd.Timedelta(hours=1)):03d}.grapes.{step_start_time.strftime('%Y%m%d%H')}"
)
forecast_036_path
PosixPath('/g2/nwp_vfy/operation/EC/rain036.grapes.2020073012')
field_036 = load_field_from_file(
    forecast_036_path
)
加载 current_forecast_hour - 24 时效的数据,用于计算 24 小时累计降水
start_forecast_hour = current_forecast_hour - pd.Timedelta(hours=24)
forecast_012_path = pathlib.Path(
    forecast_root,
    f"rain{int(start_forecast_hour / pd.Timedelta(hours=1)):03d}.grapes.{step_start_time.strftime('%Y%m%d%H')}"
)
forecast_012_path
PosixPath('/g2/nwp_vfy/operation/EC/rain012.grapes.2020073012')
field_012 = load_field_from_file(
    forecast_012_path
)
计算降水
field_rain = field_036 - field_012
field_rain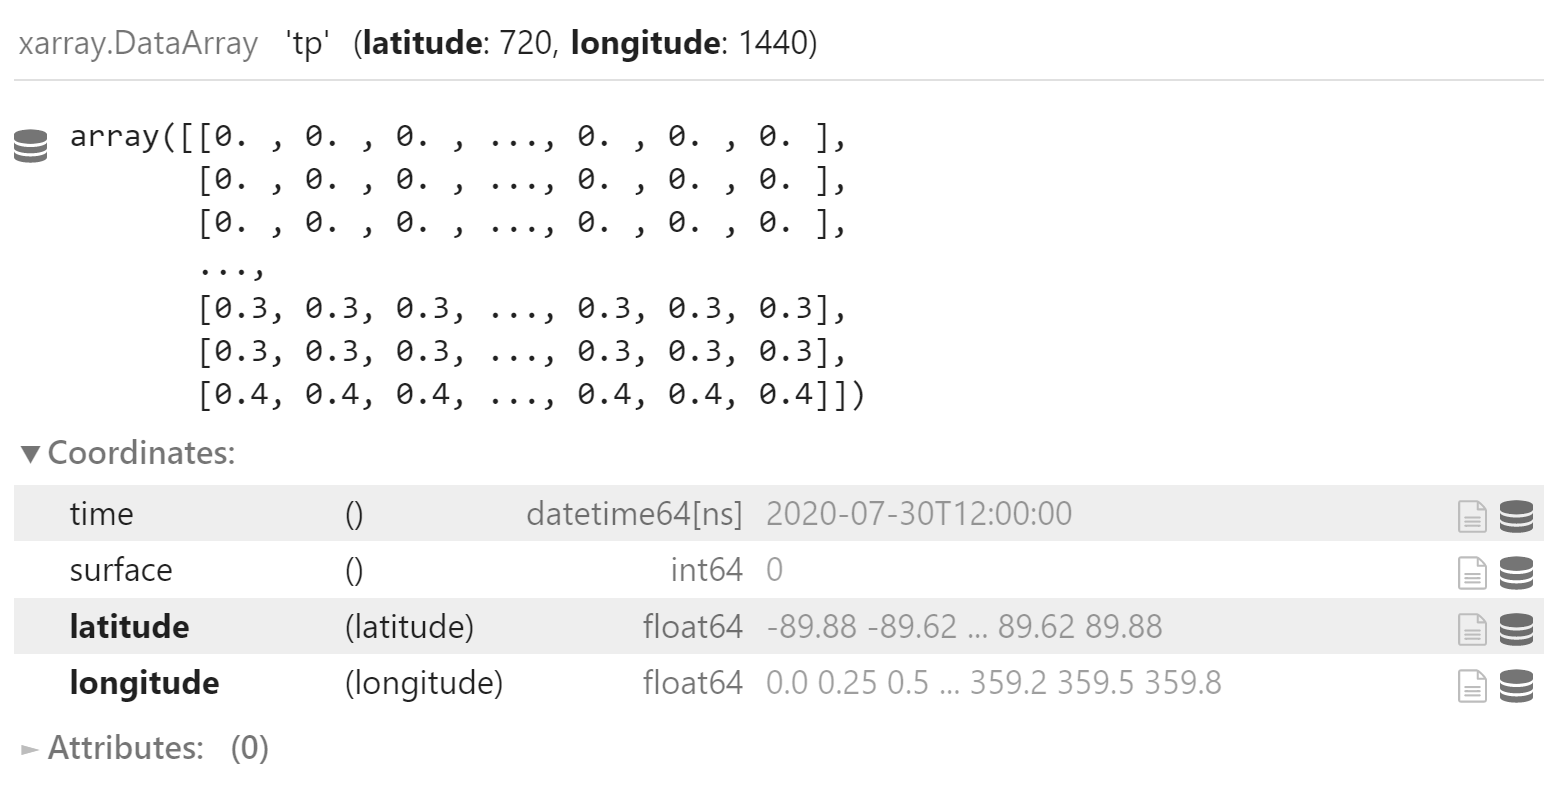
裁剪
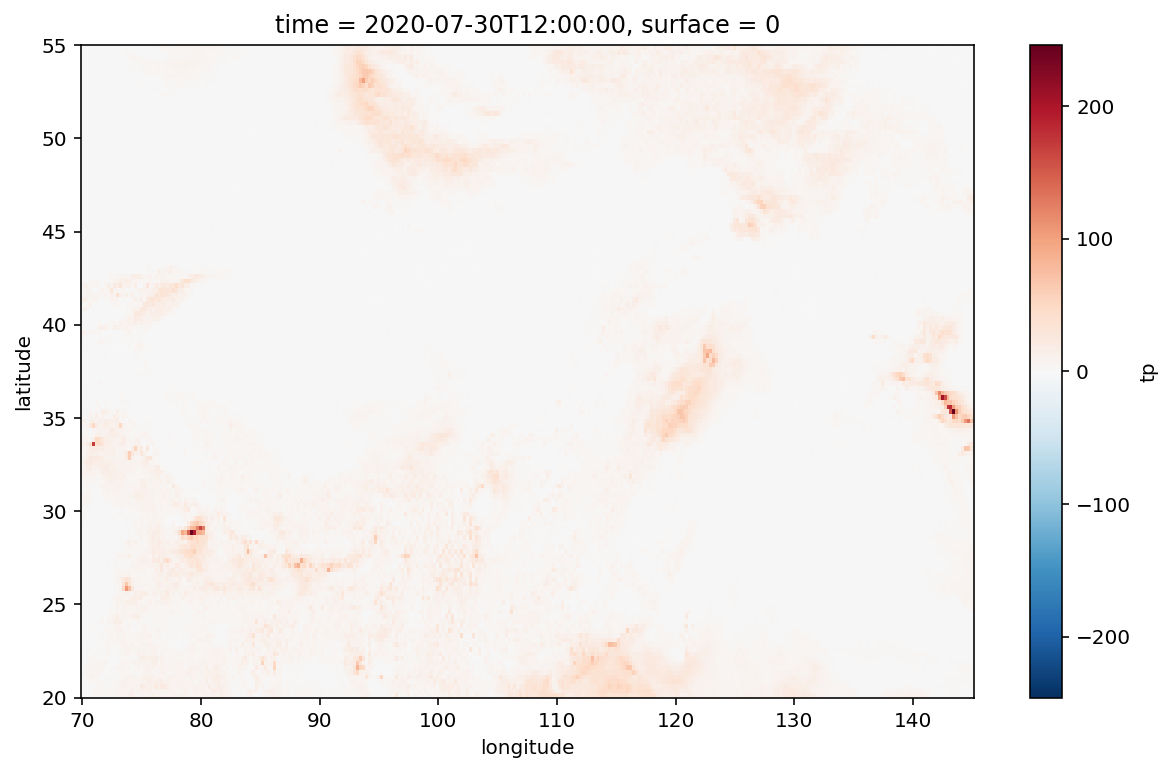
按 domain 区域裁剪
domain_field_rain = field_rain.sel(
    latitude=slice(20, 55),
    longitude=slice(70, 145)
)
domain_field_rain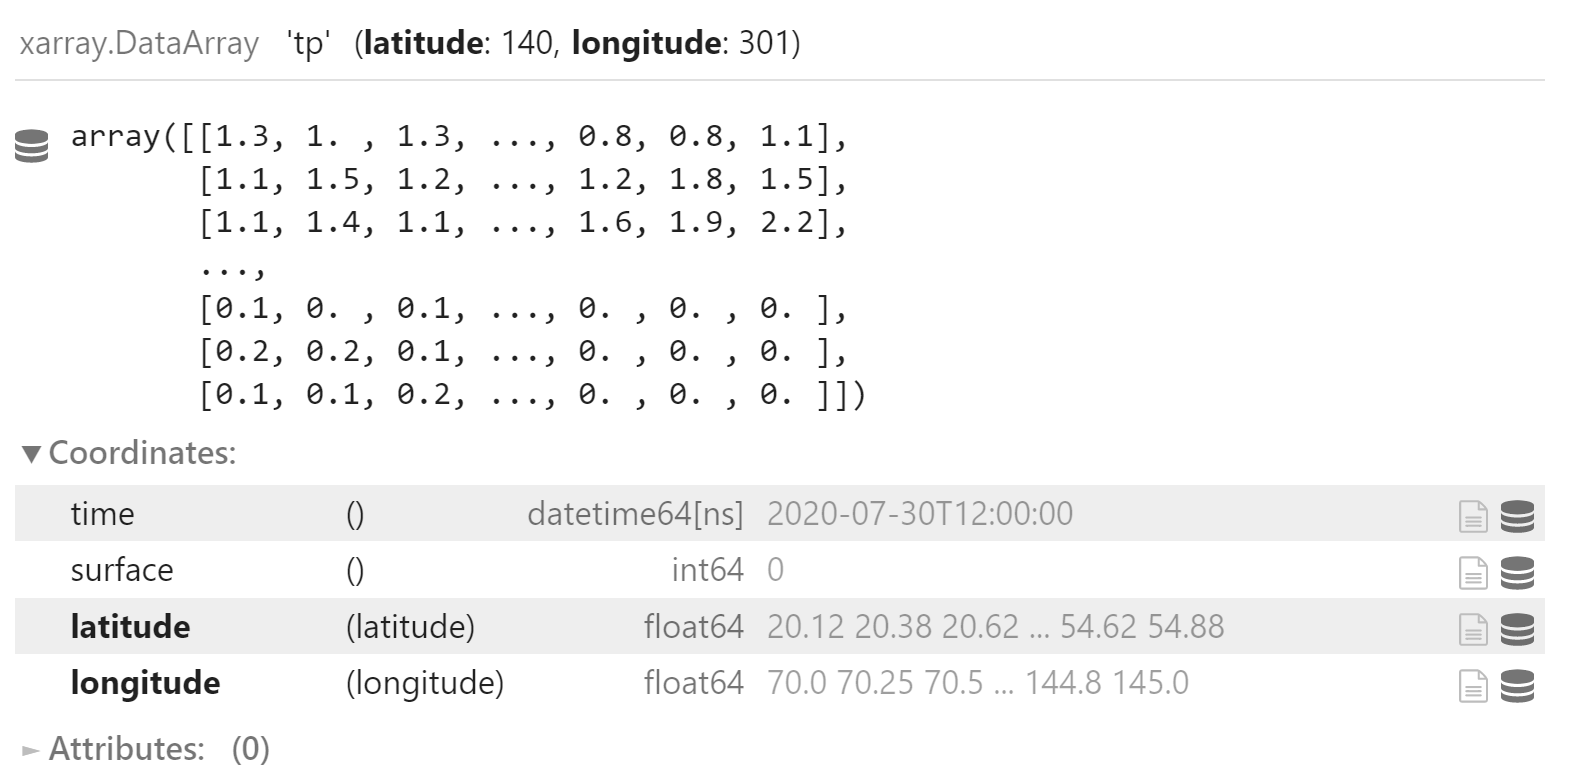
domain_field_rain.plot(
    figsize=(10, 6)
)
使用参考工具的算法,手动计算起止坐标序号
resolution = 0.25
start_latitude_index = int((89.875 + domain[0]) / resolution)
start_latitude_index
439
end_latitude_index = int((89.875 + domain[1]) / resolution)
end_latitude_index
579
start_longitude_index = int(domain[2] / resolution)
start_longitude_index
280
end_longitude_index = int(domain[3] / resolution)
end_longitude_index
580
使用 isel() 裁剪
domain_field_rain = field_rain.isel(
    latitude=slice(start_latitude_index, end_latitude_index),
    longitude=slice(start_longitude_index, end_longitude_index)
)
domain_field_rain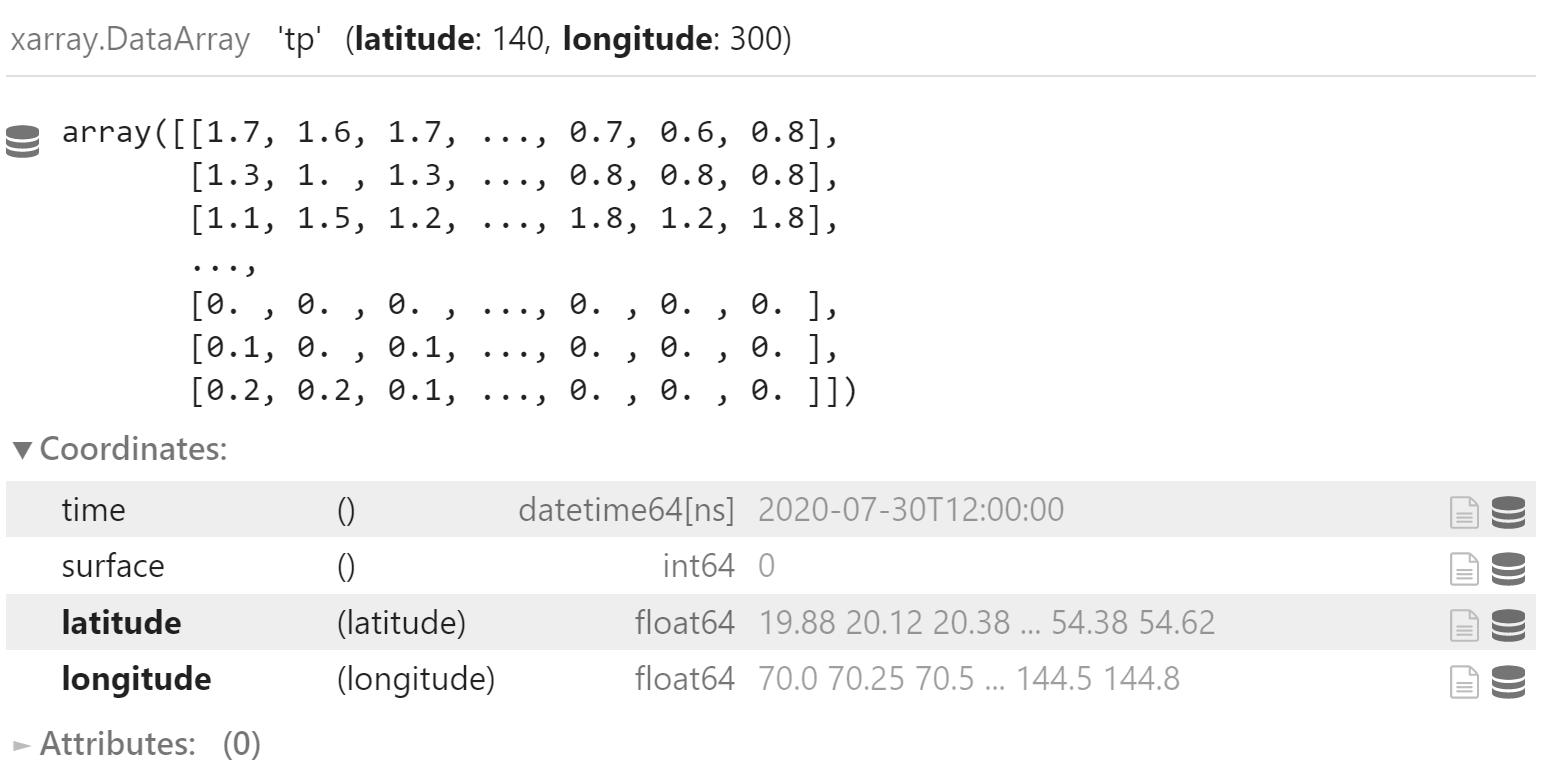
与之前使用 sel() 方法获取的数据对比,有如下不同:
- latitude 比
sel()版左移一位 - longitude 比
sel()版少一个值
为了对比计算结果,后续计算均使用 isel() 方法生成子区域数据
掩码
使用单独的掩码,已在之前的文章中介绍。
mask_file_path = "/some/path/to/landmask.grib"
mask_field = load_field_from_file(
    mask_file_path,
)
mask_field.attrs["long_name"] = "landmask"
观测
首先从原始观测开始
原始观测
24 小时降水路径
obs_file_path = find_local_file(
    "muvos/obs/grid/ana/rain_24",
    start_time=current_date,
    data_class="vfy"
)
obs_file_path
PosixPath('/g2/nwp_vfy/MUVOS/obs/grid_ANA/rain/rain_24/grib/202008/obs.2020080100.grb1')
载入数据
obs_field = load_field_from_file(
    obs_file_path
)
obs_field = obs_field.where(obs_field != 9999.)
obs_field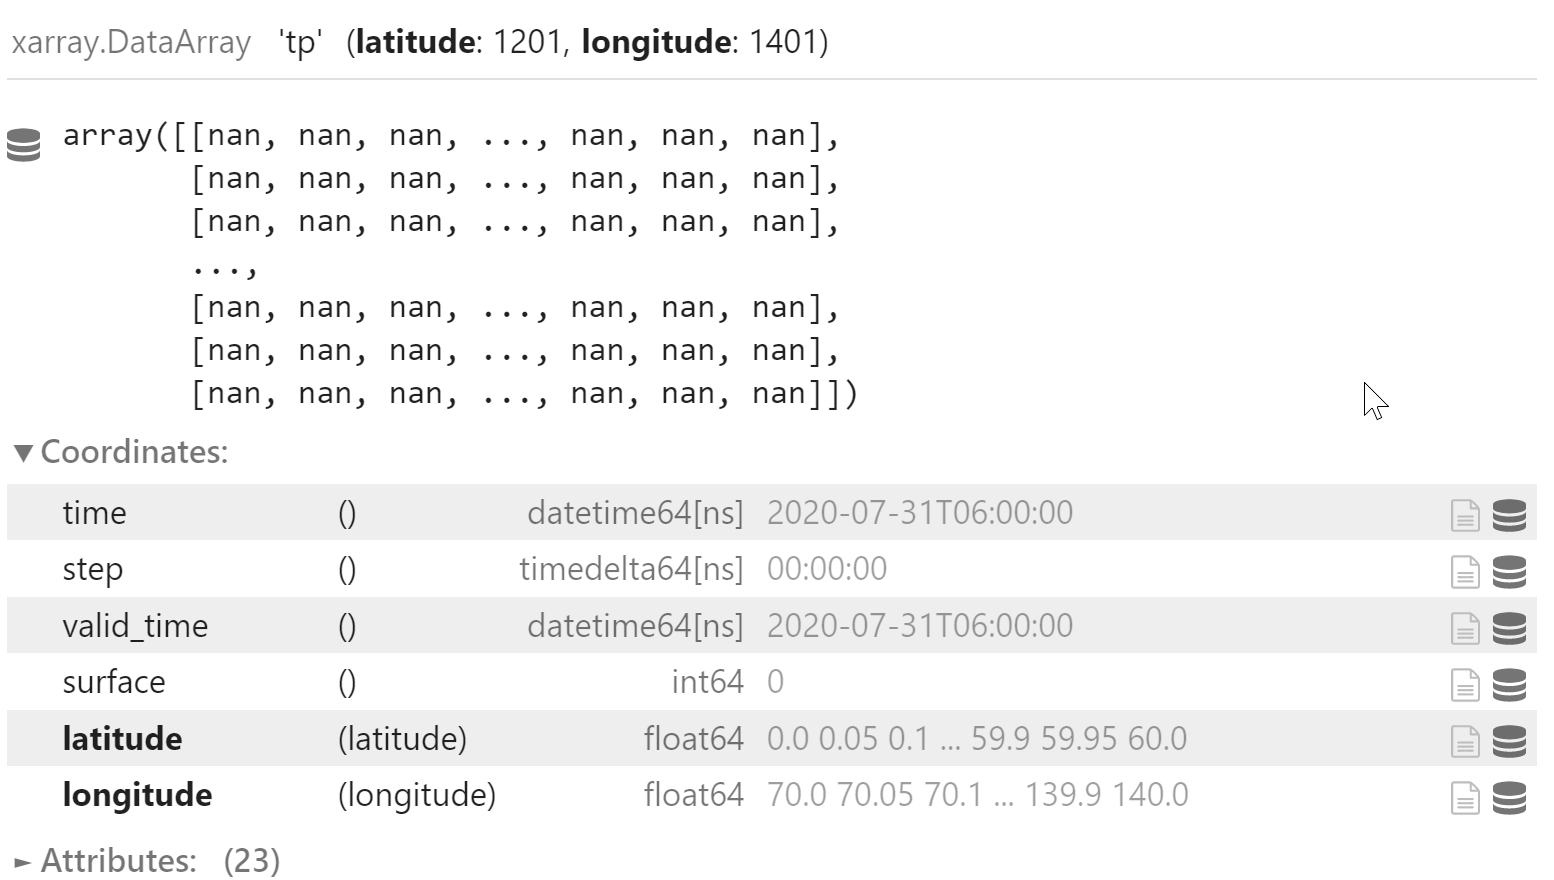
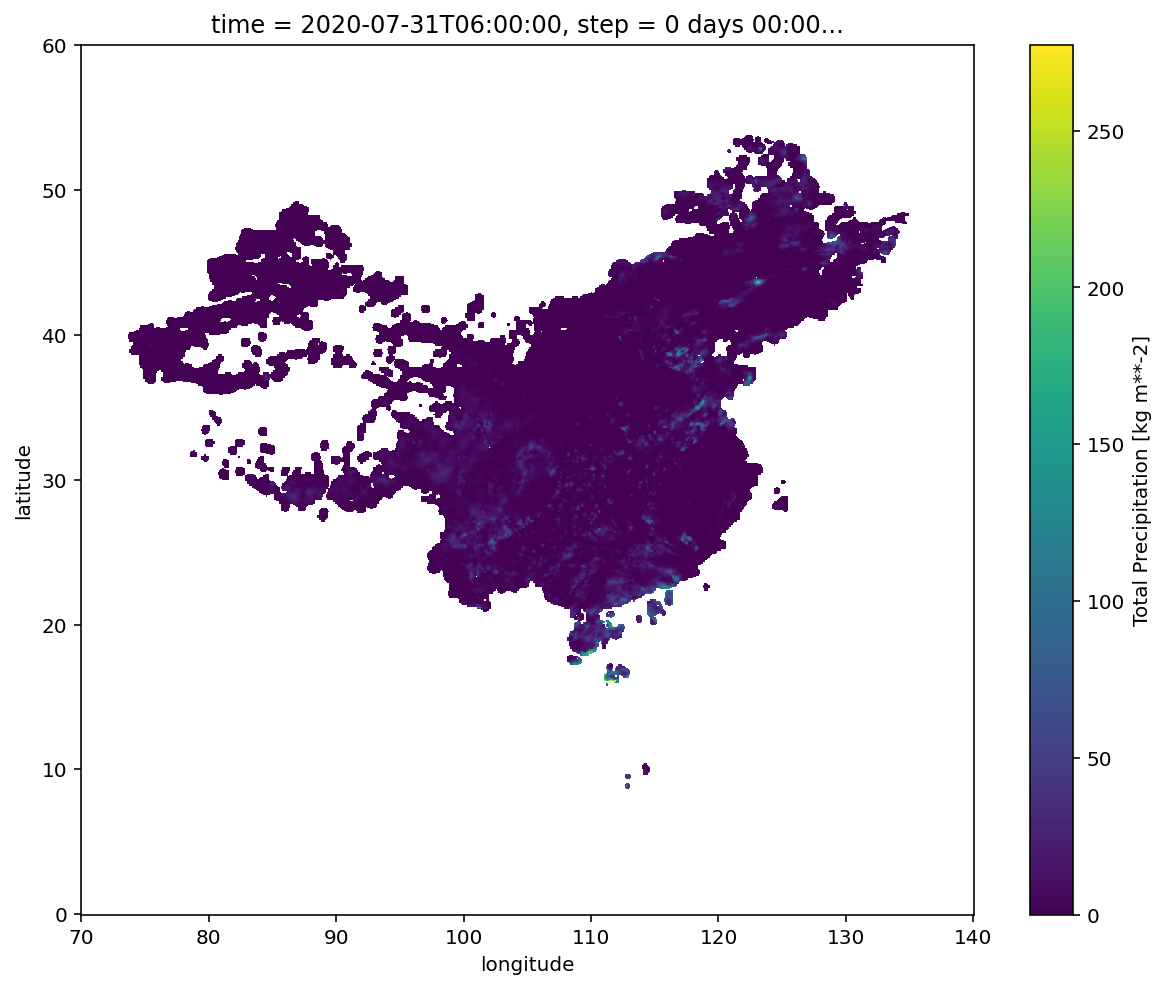
绘制填充图,可以看到观测数据的范围
obs_field.plot(
    figsize=(10, 8)
)
处理
观测资料分辨率是 0.5 度,预报数据分辨率是 0.125 度(已插值成与 GRAPES GFS 相同的分辨率)
需要对观测资料进行插值
interp_domain_obs_field = obs_field.interp_like(domain_field_rain)
interp_domain_obs_field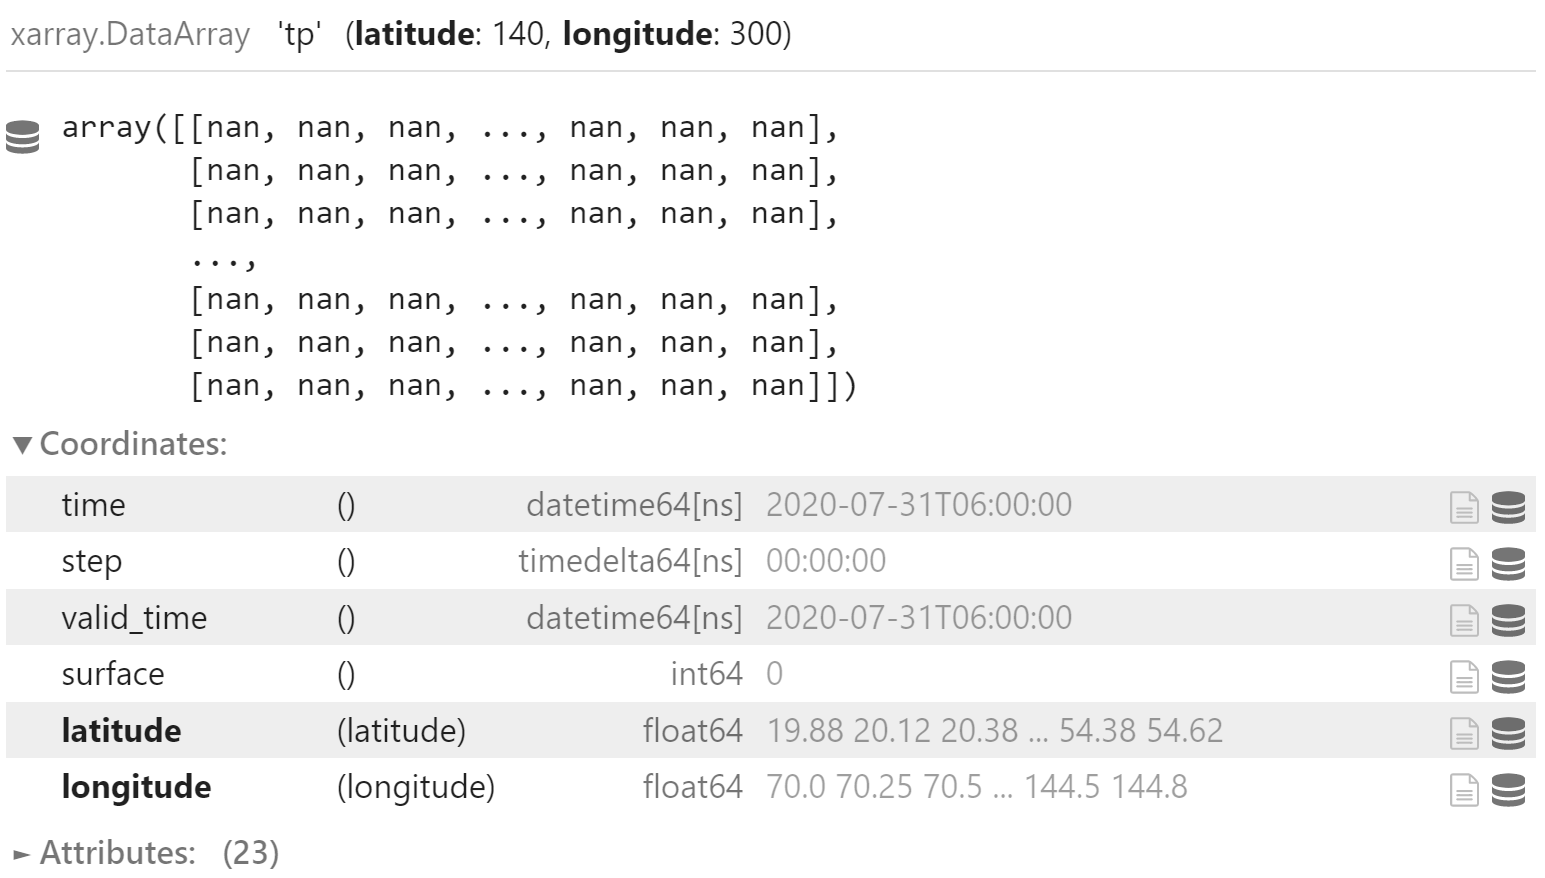
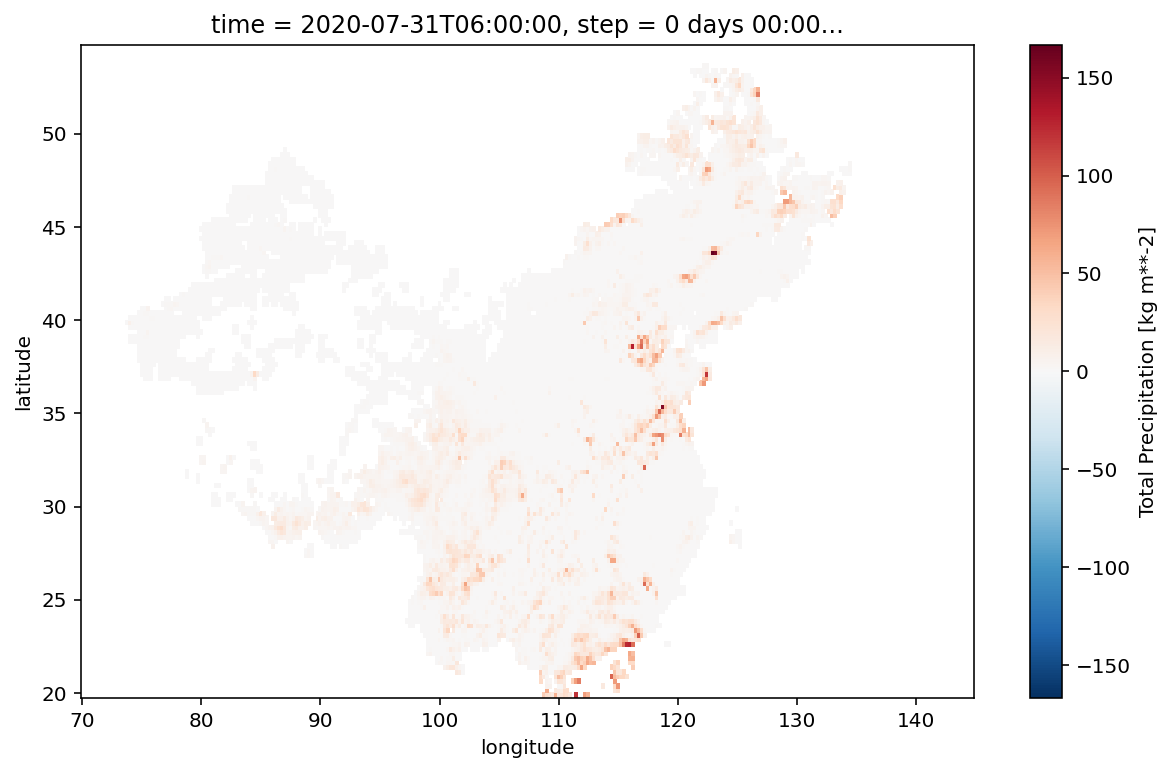
对插值后的观测资料绘图
interp_domain_obs_field.plot(
    figsize=(10, 6)
)
已插值的观测数据
观测数据已使用 copygb 插值到目标网格。
载入数据,并将缺失值 9999. 设为 np.nan。
file_path = "/some/path/to/run_grapes/OBS/obs24.2020080100.grib"
prep_obs_field = load_field_from_file(file_path)
prep_obs_field = prep_obs_field.where(prep_obs_field != 9999)
提取子区域
domain_prep_obs_field = prep_obs_field.isel(
    latitude=slice(start_latitude_index, end_latitude_index),
    longitude=slice(start_longitude_index, end_longitude_index)
)
domain_prep_obs_field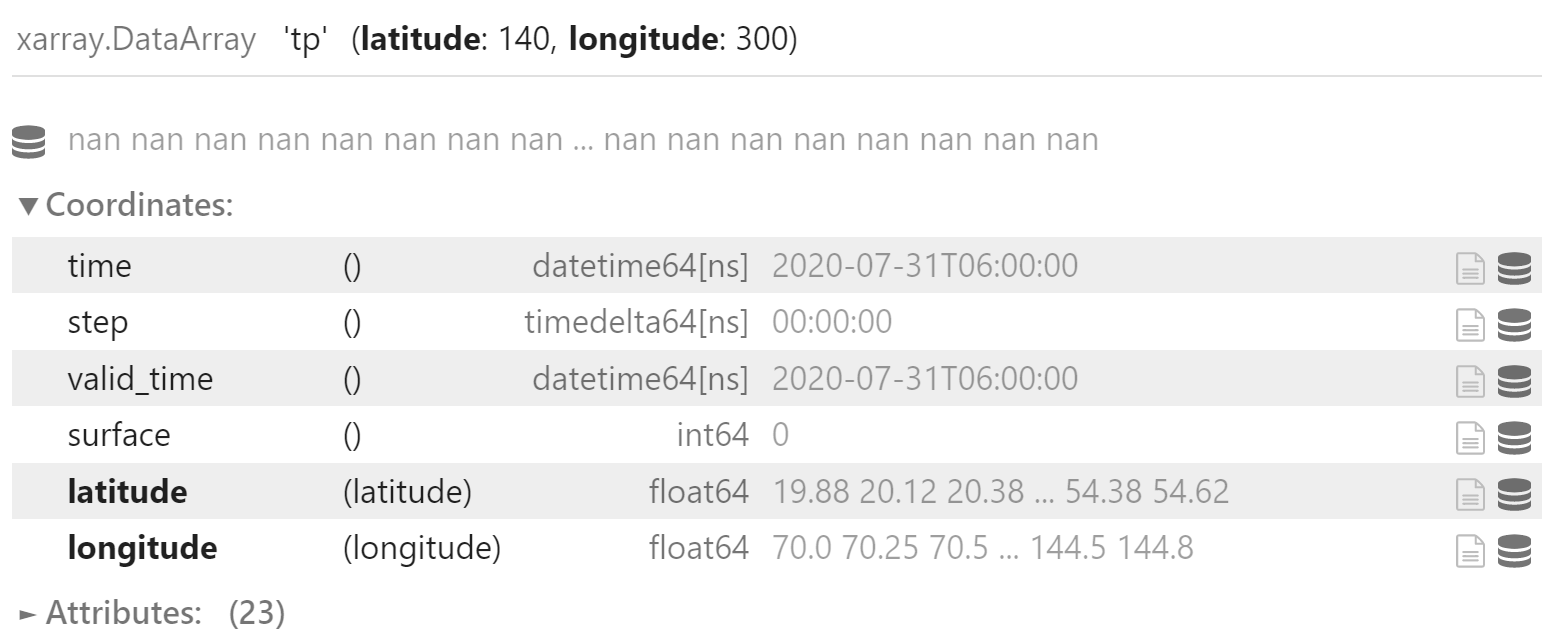
与上节使用 xarray 插值得到的结果不一致
注:笔者后续会继续研究为什么两个插值结果不一致
np.max(np.abs(interp_domain_obs_field - domain_prep_obs_field)).item()0.5000000000000604
为了与参考工具保持一致,使用 copygb 的插值数据。
整合
将原始数据整合为 xarray.Dataset 对象
ds = xr.Dataset({
    "obs": prep_obs_field.reset_coords(drop=True),
    "forecast": field_rain.reset_coords(drop=True),
})
ds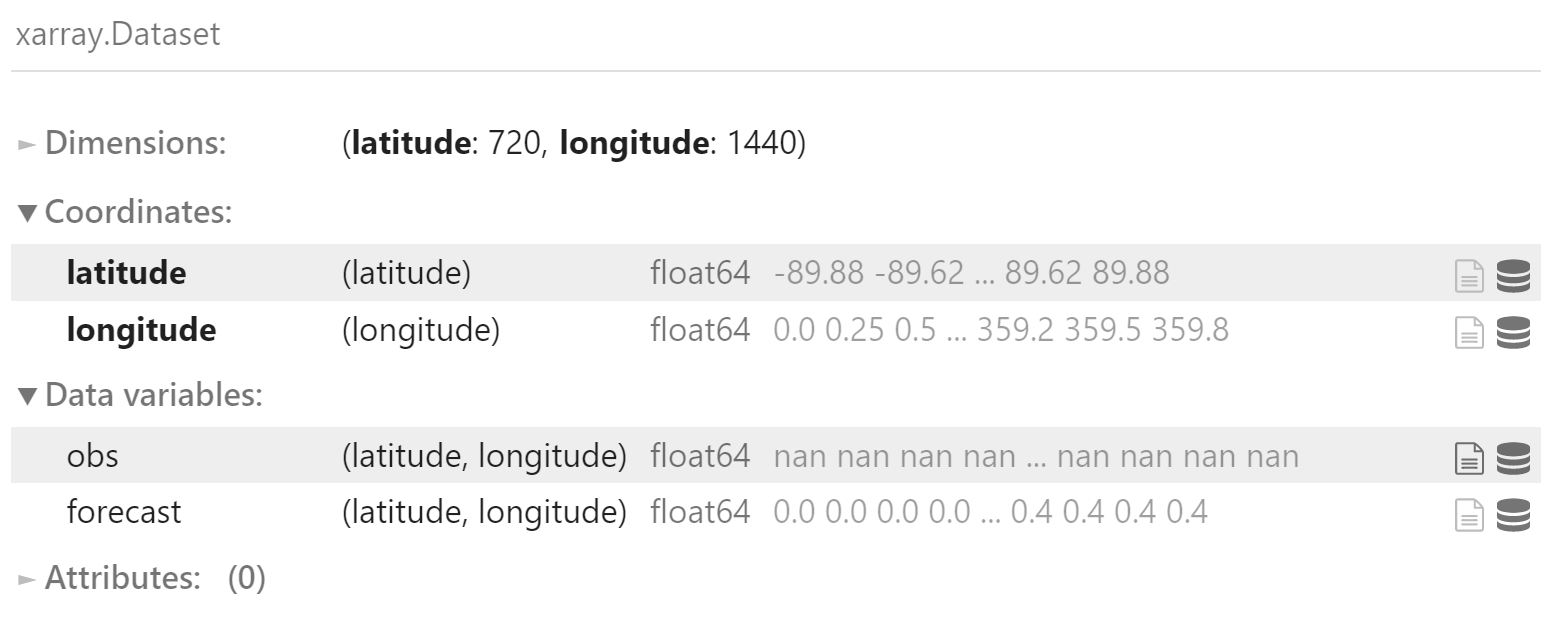
提取子区域
domain_ds = ds.isel(
    latitude=slice(start_latitude_index, end_latitude_index),
    longitude=slice(start_longitude_index, end_longitude_index)
)
domain_ds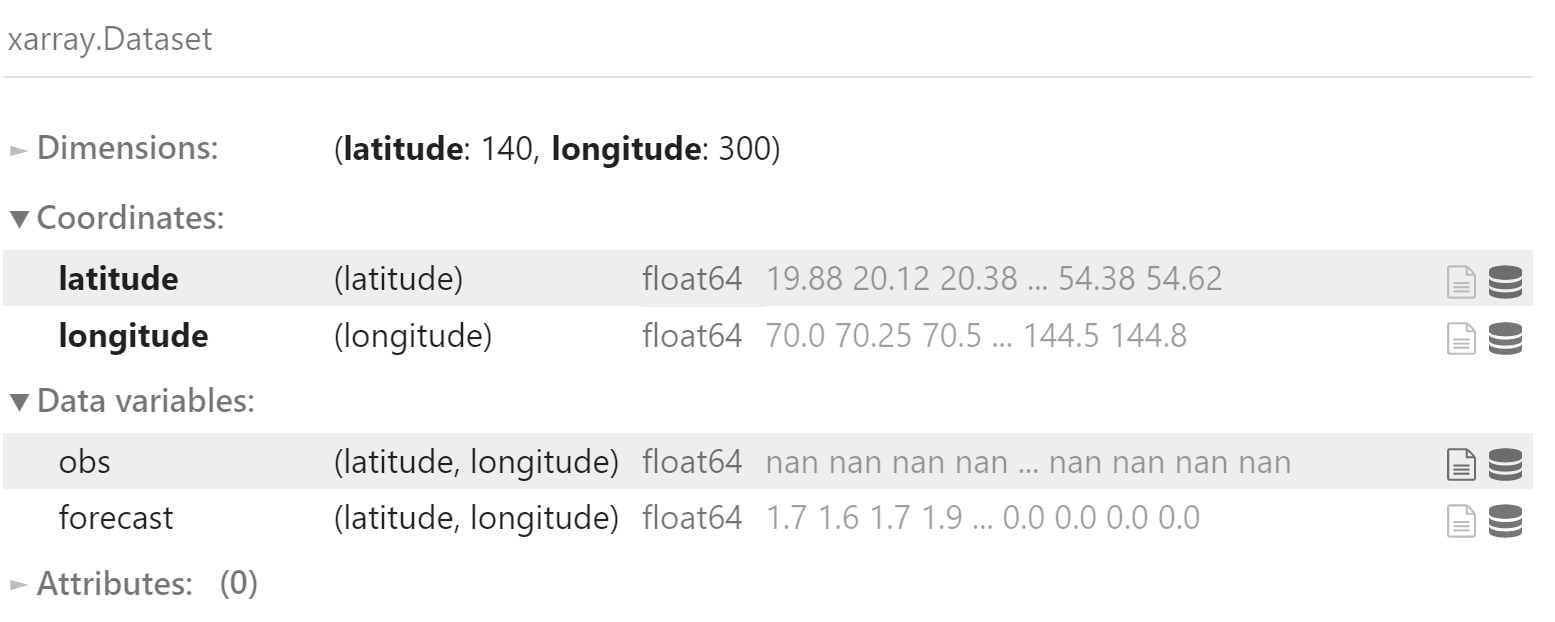
应用掩码
masked_ds = domain_ds.where(
    mask_field
)
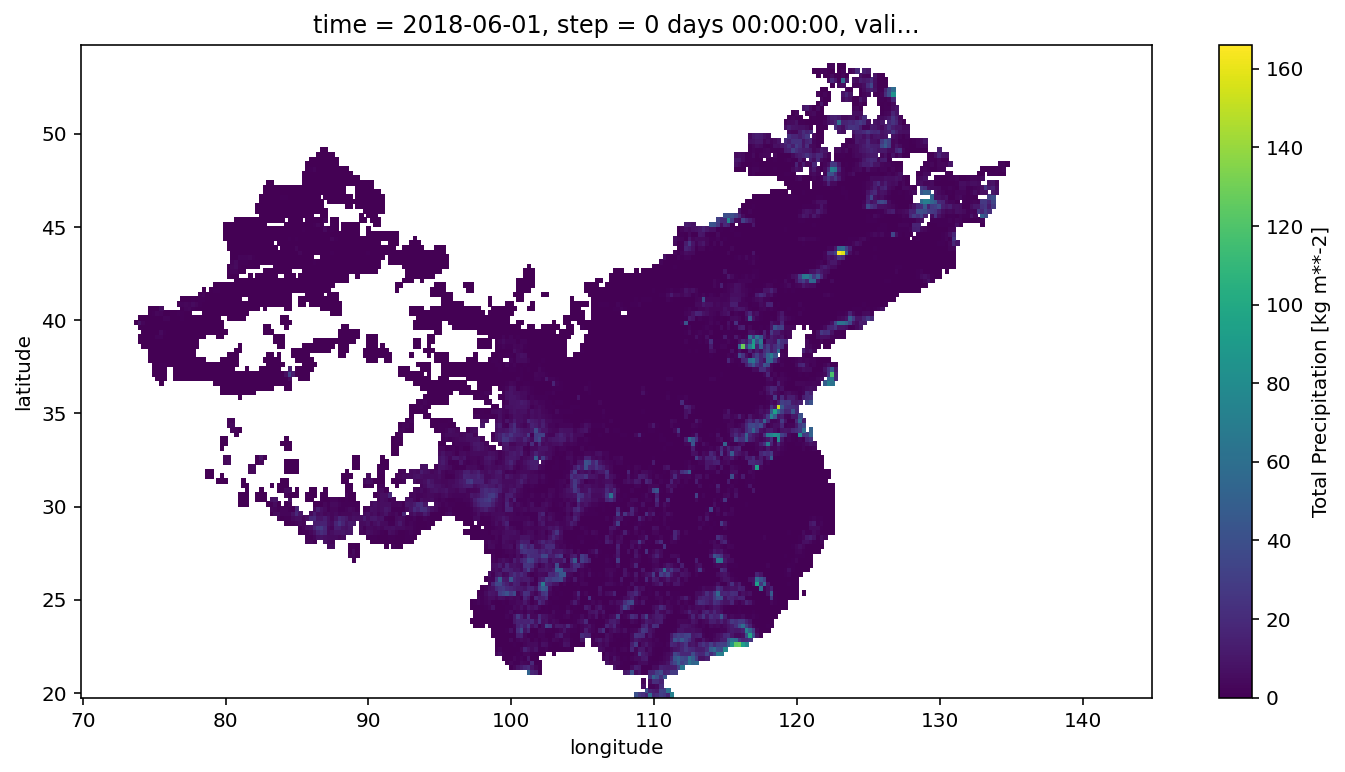
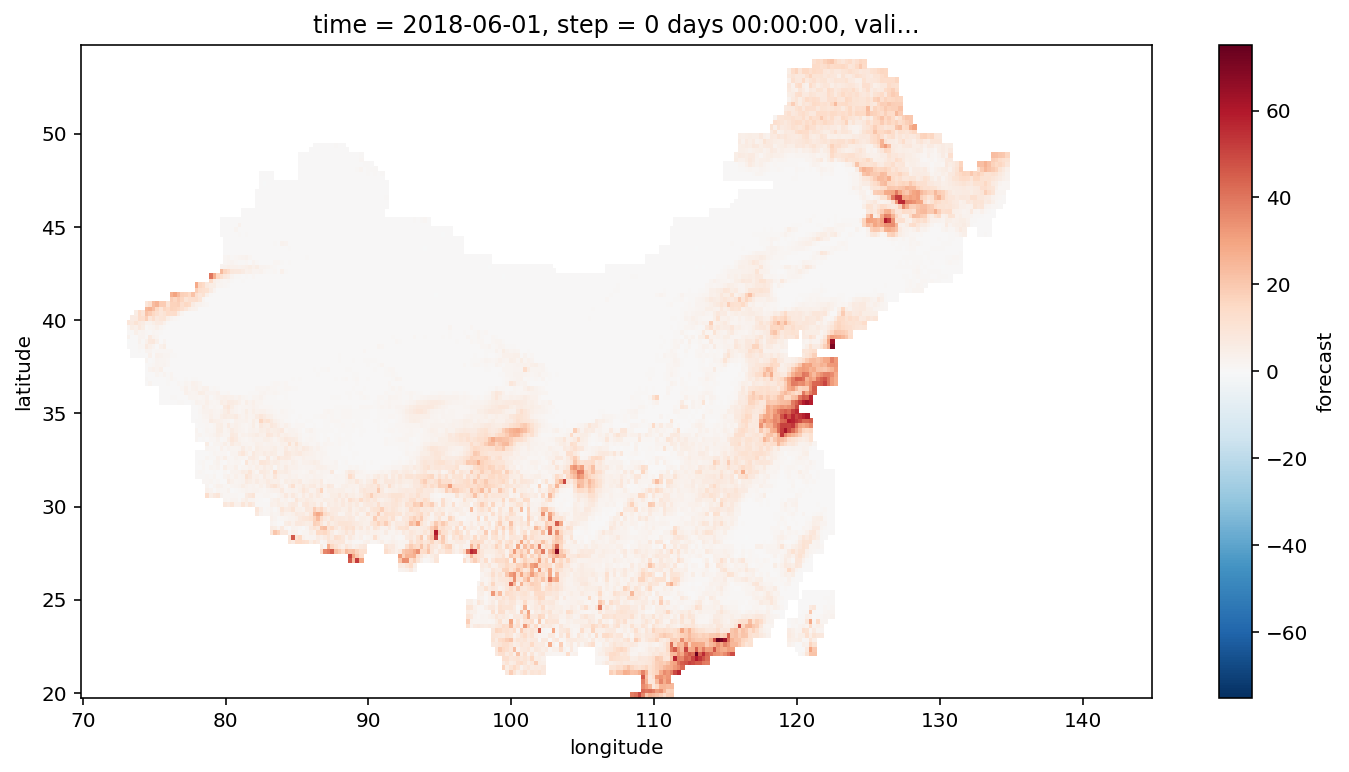
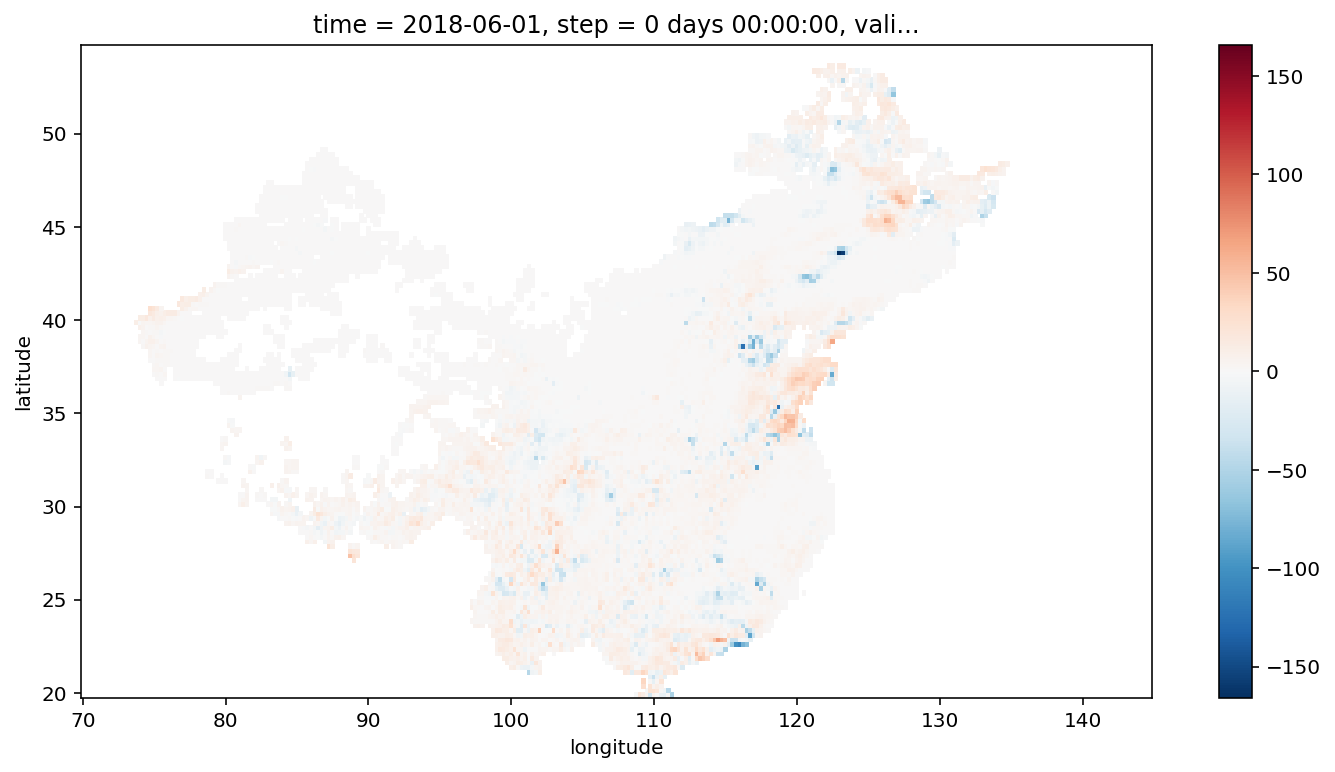
使用掩码后的数据示意图
masked_ds.obs.plot(
    figsize=(12, 6)
)
masked_ds.forecast.plot(
    figsize=(12, 6)
)
(masked_ds.forecast - masked_ds.obs).plot(
    figsize=(12, 6)
)
计算
列联表
计算给定阈值的列联表
threshold = 25hits
xr.where(
    (masked_ds.obs >= threshold) & (masked_ds.forecast >= threshold),
    1,
    0
).sum().item()
90
false alarms
xr.where(
    (masked_ds.forecast >= threshold) & (masked_ds.obs < threshold) & (masked_ds.obs >= 0.0 ),
    1,
    0
).sum().item()
293
misses
xr.where(
    (masked_ds.obs >= threshold) & (masked_ds.forecast < threshold) & (masked_ds.forecast >= 0.0 ),
    1,
    0
).sum().item()
336
correct negatives
xr.where(
    (masked_ds.forecast < threshold) & (masked_ds.obs < threshold) & (masked_ds.forecast >= 0.0 ) & (masked_ds.obs >= 0.0 ),
    1,
    0
).sum().item()
11949
批量计算
合并为函数
def calculate_matrix(obs, forecast, threshold):
    hits = xr.where(
        (obs >= threshold) & (forecast >= threshold),
        1,
        0
    ).sum().item()

    false_alarms = xr.where(
        (forecast >= threshold) & (obs < threshold) & (obs >= 0.0),
        1,
        0
    ).sum().item()

    misses = xr.where(
        (obs >= threshold) & (forecast < threshold) & (forecast >= 0.0),
        1,
        0
    ).sum().item()

    correct_negatives = xr.where(
        (forecast < threshold) & (obs < threshold) & (forecast >= 0.0) & (obs >= 0.0),
        1,
        0
    ).sum().item()

    return (hits, false_alarms, misses, correct_negatives)
计算所有阈值的列联表
rows = []
for threshold in thresholds:
    matrix_values = [
        calculate_matrix(
            masked_ds.obs,
            masked_ds.forecast,
            threshold=threshold,
        )
    ]
    matrix = np.array(matrix_values)
    row = matrix.sum(axis=0)
    rows.append(row)

df_matrix = pd.DataFrame(
    rows,
    columns=[
        "hits",
        "false_alarms",
        "misses",
        "correct_negatives",
    ],
)
df_matrix["threshold"] = thresholds
计算结果
df_matrix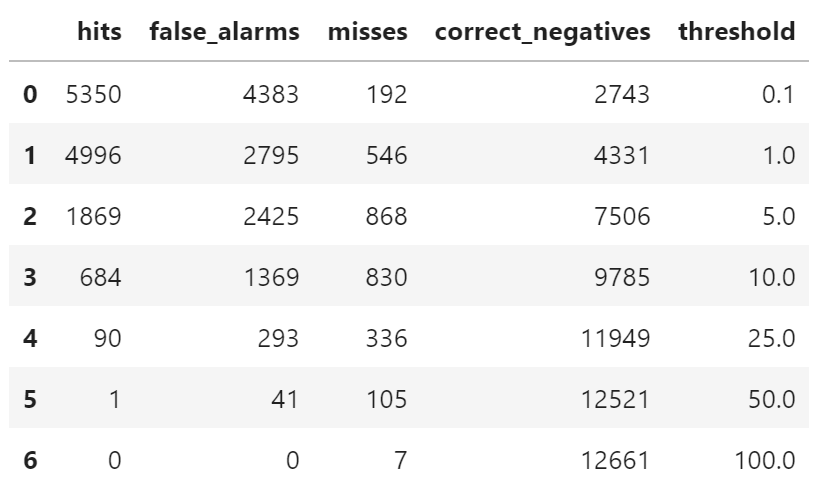
对比参考结果
一共 12668 条数据
           AA      BB     CC      DD
0.1  mm     5350   4383    192   2743
  1  mm     4996   2795    546   4331
  5  mm     1869   2425    868   7506
 10  mm      684   1369    830   9785
 25  mm       90    293    336  11949
 50  mm        1     41    105  12521
100  mm        0      0      7  12661
两者结果一致
Meteva
使用 meteva.method.contingency_table_multicategory 计算列联表
import meteva.method as mem

mem.contingency_table_multicategory(
    masked_ds.obs.values,
    masked_ds.forecast.values,
    grade_list=[25],
)
array([[11955., 336., 12291.],
[ 293., 90., 383.],
[12248., 426., 12674.]])
对于 10mm 降水,仅有 correct negatives 的结果与上面不一致。 这是因为 forecast 数据中有负值,上面的计算将负值过滤掉。
注:笔者尚不清楚为什么会有负值
将预报场中小于 0 的值都设为 np.nan
forecast = masked_ds.forecast.where(
    masked_ds.forecast >= 0.0
)
重新计算列联表,得到的结果与上面计算一致
mem.contingency_table_multicategory(
    masked_ds.obs.values,
    forecast.values,
    grade_list=[25],
)
array([[11949., 336., 12285.],
[ 293., 90., 383.],
[12242., 426., 12668.]])
参考
https://www.cawcr.gov.au/projects/verification/
模式检验系列文章
