学习R语言:因子和表
本文内容来自《R 语言编程艺术》(The Art of R Programming),有部分修改
因子 (factor) 的设计思想来源于统计学中的名义变量 (nominal variables),或称之为分类变量 (categorical variables)。 这种变量的值本质上不是数字,而是对应为分类。
因子与水平
x <- c(5, 12, 13, 12)
xf <- factor(x)
print(xf)
[1] 5  12 13 12
Levels: 5 12 13
xf 中的不同数值 (5, 12, 13) 就是水平 (level)
str(xf)
Factor w/ 3 levels "5","12","13": 1 2 3 2
print(unclass(xf))
[1] 1 2 3 2
attr(,"levels")
[1] "5"  "12" "13"
上述结果中第一行表示水平列表的序号,即第一个值是第一个水平,即 5。
str(unclass(xf))
 int [1:4] 1 2 3 2
 - attr(*, "levels")= chr [1:3] "5" "12" "13"
因子的长度是数据的长度
print(length(xf))
4
可以在创建因子时提前插入新水平
x <- c(5, 12, 13, 12)
xff <- factor(
    x,
    levels=c(5, 12, 13, 88)
)
print(xff)
[1] 5  12 13 12
Levels: 5 12 13 88
xff[2] <- 88
print(xff)
[1] 5  88 13 12
Levels: 5 12 13 88
不能添加新的水平,新的值会被设为 NA
xff[2] <- 28
print(xff)
Warning message in `[<-.factor`(`*tmp*`, 2, value = 28):
"invalid factor level, NA generated"
[1] 5    <NA> 13   12
Levels: 5 12 13 88
因子的常用函数
tapply 函数
tapply(x, f, g)
将向量 x 按因子 f 分组,对每个分组的自向量应用函数 g
d <- data.frame(
    list(
        gender=c("M", "M", "F", "M", "F", "F"),
        age=c(47, 59, 21, 32, 33, 24),
        income=c(55000, 88000, 32450, 76500, 12300, 45650)
    )
)
print(d)
  gender age income
1      M  47  55000
2      M  59  88000
3      F  21  32450
4      M  32  76500
5      F  33  12300
6      F  24  45650
d$over25 <- ifelse(d$age > 25, 1, 0)
print(d)
  gender age income over25
1      M  47  55000      1
2      M  59  88000      1
3      F  21  32450      0
4      M  32  76500      1
5      F  33  12300      1
6      F  24  45650      0
print(tapply(
    d$income,
    list(d$gender, d$over25),
    mean
))
      0        1
F 39050 12300.00
M    NA 73166.67
split() 函数
split(x, f)
将 x 按因子 f 分组
print(d)
  gender age income over25
1      M  47  55000      1
2      M  59  88000      1
3      F  21  32450      0
4      M  32  76500      1
5      F  33  12300      1
6      F  24  45650      0
split() 返回一个列表
print(split(
    d$income,
    list(d$gender, d$over25)
))
$F.0
[1] 32450 45650

$M.0
numeric(0)

$F.1
[1] 12300

$M.1
[1] 55000 88000 76500
简化《向量》章节中的方法
g <- c("M", "F", "F", "I", "M", "M", "F")
print(split(1:7, g))
$F
[1] 2 3 7

$I
[1] 4

$M
[1] 1 5 6
简化《列表》章节中的文本词汇索引示例
findwords <- function(tf) {
    txt <- scan(tf, "")
    words <- split(1:length(txt), txt)
    return(words)
}
by() 函数
可以应用于对象
title <- c(
    "Gender",
    "Length",
    "Diameter",
    "Height",
    "WholeWt",
    "ShuckedWt",
    "ViscWt",
    "ShellWt",
    "Rings"
)

aba <- read.csv(
    "../data/abalone.data",
    header=FALSE,
    col.names=title
)
针对不同的性别做回归分析
by(
    aba,
    aba$Gender,
    function(m) lm(m[,2]~m[,3])
)
aba$Gender: F

Call:
lm(formula = m[, 2] ~ m[, 3])

Coefficients:
(Intercept)       m[, 3]
    0.04288      1.17918

------------------------------------------------------------
aba$Gender: I

Call:
lm(formula = m[, 2] ~ m[, 3])

Coefficients:
(Intercept)       m[, 3]
    0.02997      1.21833

------------------------------------------------------------
aba$Gender: M

Call:
lm(formula = m[, 2] ~ m[, 3])

Coefficients:
(Intercept)       m[, 3]
    0.03653      1.19480
表的操作
列联表 contingency table
u <- c(22, 8, 33, 6, 8, 29, -2)
fl <- list(
    c(5, 12, 13, 12, 13, 5, 13),
    c("a", "bc", "a", "a", "bc", "a", "a")
)
print(tapply(u, fl, length))
   a bc
5  2 NA
12 1  1
13 2  1
ct <- read.table(
    "../data/ct.dat",
    header=T
)
print(ct)
  Vote.for.X Voted.For.X.Last.Time
1        Yes                   Yes
2        Yes                    No
3         No                    No
4   Not Sure                   Yes
5         No                    No
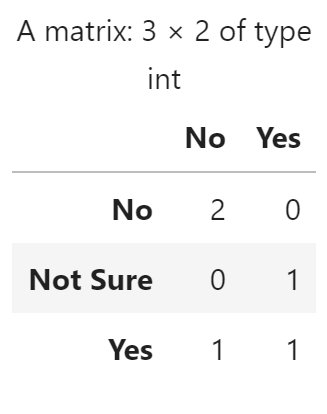
table() 生成列联表
cttab <- table(ct)
cttab
          Voted.For.X.Last.Time
Vote.for.X No Yes
  No        2   0
  Not Sure  0   1
  Yes       1   1
对于向量,table() 生成频数表
print(table(c(5, 12, 13, 12, 8, 5)))
 5  8 12 13
 2  1  2  1
三维表格
vote <- read.csv(
    "../data/vote.csv",
    header=T
)
print(vote)
  gender race pol
1      M    W   L
2      M    W   L
3      F    A   C
4      M    O   L
5      F    B   L
6      F    B   C
vt <- table(vote)
vt
, , pol = C

      race
gender A B O W
     F 1 1 0 0
     M 0 0 0 0

, , pol = L

      race
gender A B O W
     F 0 1 0 0
     M 0 0 1 2
表中有关矩阵和类似数组的操作
大多数(非数学的)矩阵/数组运算可以用在数据框上,也可以用于表
print(class(cttab))
[1] "table"
print(cttab[1, 1])
[1] 2
print(cttab[1, ])
 No Yes
  2   0
print(cttab/5)
          Voted.For.X.Last.Time
Vote.for.X  No Yes
  No       0.4 0.0
  Not Sure 0.0 0.2
  Yes      0.2 0.2
边际值
print(apply(cttab, 1, sum))
      No Not Sure      Yes
       2        1        2
addmargins() 为表格添加边际值
print(addmargins(cttab))
          Voted.For.X.Last.Time
Vote.for.X No Yes Sum
  No        2   0   2
  Not Sure  0   1   1
  Yes       1   1   2
  Sum       3   2   5
dimnames() 获得维度的名称和水平值
print(dimnames(cttab))
$Vote.for.X
[1] "No"       "Not Sure" "Yes"

$Voted.For.X.Last.Time
[1] "No"  "Yes"
扩展案例:提取子表
编写 subtable() 函数,两个参数:
tbl:表格subnames:列表,每个组件以tbl的某个维度命名,组件的值是所需要水平的名称向量
subtable <- function(tbl, subnames) {
    tblarray <- unclass(tbl)
    dcargs <- list(tblarray)

    ndims <- length(subnames)
    for (i in 1:ndims) {
        dcargs[[i+1]] <- subnames[[i]]
    }

    subarray <- do.call("[", dcargs)

    dims <- lapply(subnames, length)

    subtbl <- array(subarray, dims, dimnames=subnames)
    class(subtbl) <- "table"
    return (subtbl)
}
示例
cttab
          Voted.For.X.Last.Time
Vote.for.X No Yes
  No        2   0
  Not Sure  0   1
  Yes       1   1
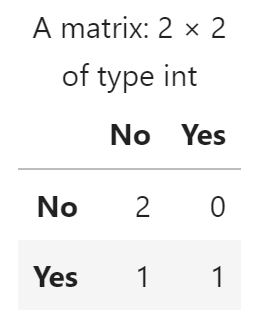
subtable(
    cttab,
    list(
        Vote.for.X=c("No", "Yes"),
        Voted.For.X.Last.Time=c("No", "Yes")
    )
)
          Voted.For.X.Last.Time
Vote.for.X No Yes
       No   2   0
       Yes  1   1
解析
subnames <- list(
    Vote.for.X=c("No", "Yes"),
    Voted.For.X.Last.Time=c("No", "Yes")
)
print(subnames)
$Vote.for.X
[1] "No"  "Yes"

$Voted.For.X.Last.Time
[1] "No"  "Yes"
print(subnames[[2]])
[1] "No" "Yes"
tblarray <- unclass(cttab)
tblarray
dcargs <- list(tblarray)
print(dcargs)
[[1]]
          Voted.For.X.Last.Time
Vote.for.X No Yes
  No        2   0
  Not Sure  0   1
  Yes       1   1
ndims <- length(subnames)
for (i in 1:ndims) {
    dcargs[[i+1]] <- subnames[[i]]
}
print(dcargs)
[[1]]
          Voted.For.X.Last.Time
Vote.for.X No Yes
  No        2   0
  Not Sure  0   1
  Yes       1   1

[[2]]
[1] "No"  "Yes"

[[3]]
[1] "No"  "Yes"
subarray <- do.call("[", dcargs)
subarray
class(subarray) <- "table"
subarray
          Voted.For.X.Last.Time
Vote.for.X No Yes
       No   2   0
       Yes  1   1
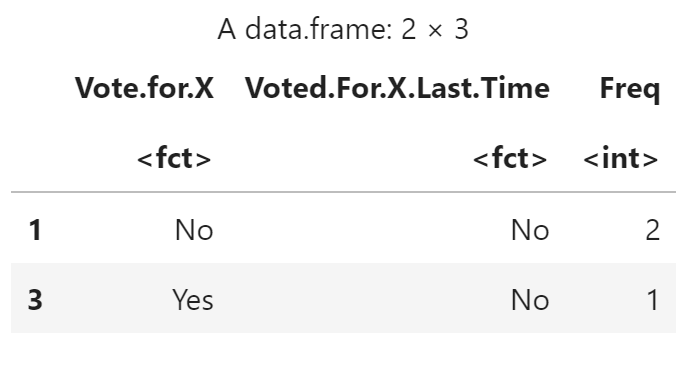
扩展案例:在表中寻找频数最大的单元格
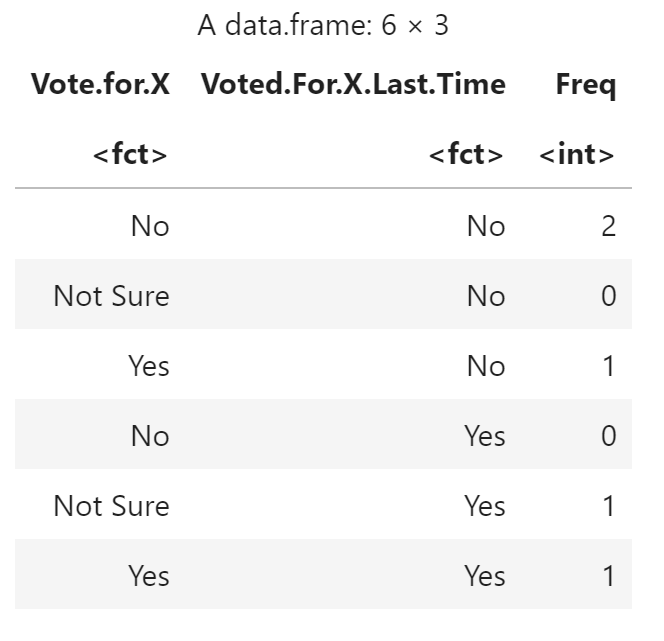
使用 as.data.frame 将表转换为数据框
as.data.frame(cttab)
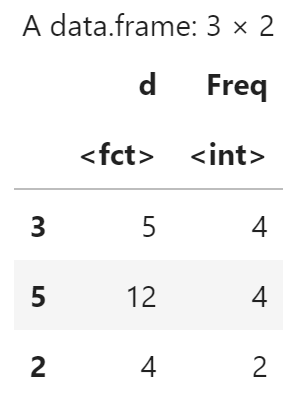
tabdom() 函数返回频数最大的 k 项
tabdom <- function(tbl, k) {
    tbldf <- as.data.frame(tbl)
    freqord <- order(tbldf$Freq, decreasing=TRUE)
    dom <- tbldf[freqord,][1:k,]
    return(dom)
}
示例
d <- c(5, 12, 13, 4, 3, 28, 12, 12, 9, 5, 5, 13, 5, 4, 12)
dtab <- table(d)
dtab
d
 3  4  5  9 12 13 28
 1  2  4  1  4  2  1
tabdom(dtab, 3)
tabdom(cttab, 2)
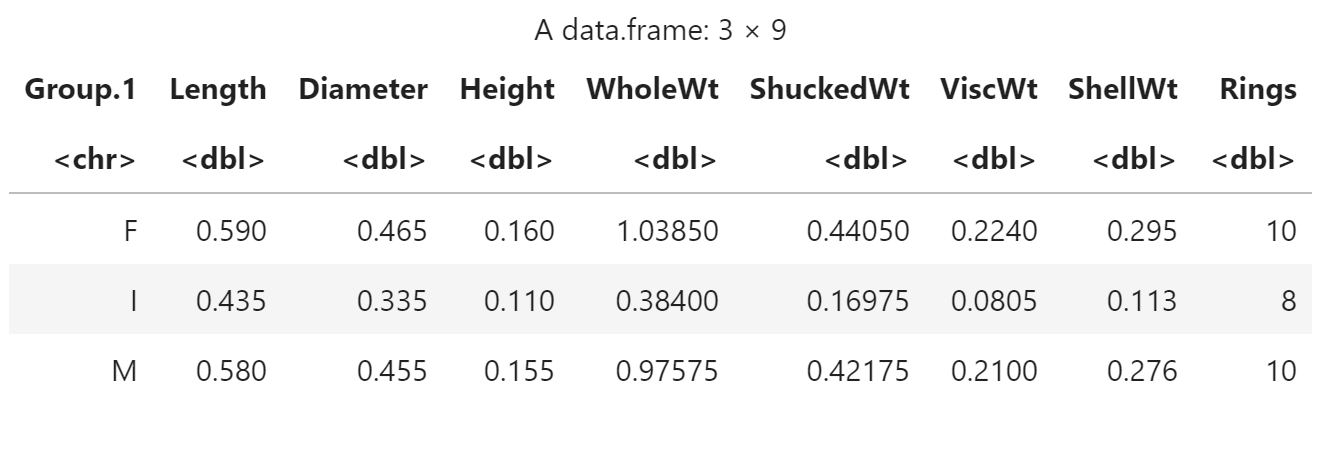
其他与因子和表有关的函数
aggregate() 函数
对分组中的每个变量调用 tapply() 函数
aggregate(
    aba[, -1],
    list(aba$Gender),
    median
)
cut()函数
需要一个数据向量 x 和由向量 b 定义的一组区间,cut() 函数将决定 x 中每个元素落入哪个区间。
y <- cut(x, b, labels=FALSE)
列表表示的区间,左开右闭
(b[1], b[2]], (b[2], b[3]], …
z <- runif(8, 0, 1)
print(z)
[1] 0.28521041 0.54308030 0.17111995 0.39283332 0.66579177 0.02951978 0.79347348
[8] 0.86720973
binmarks <- seq(from=0.0, to=1.0, by=0.1)
print(binmarks)
[1] 0.0 0.1 0.2 0.3 0.4 0.5 0.6 0.7 0.8 0.9 1.0
print(cut(z, binmarks, labels=F))
[1] 3 6 2 4 7 1 8 9
参考
学习 R 语言系列文章:
《快速入门》
《向量》
《矩阵和数组》
《列表》
《数据框》
本文的 Jupyter Notebook 代码请访问如下项目:
