计算等压面要素场检验指标 - 多时效
上一篇文章《使用 xarray 计算单个要素场的基本检验指标》介绍为单个时次的单个时效的等压面要素场计算检验指标。
本文继续介绍如何为多个时次的多个时效计算检验指标,并将其汇总成表格形式,方便进行持久化保存。
准备
导入需要的包
import numpy as np
import xarray as xr
import pandas as pd

import eccodes

import pathlib

from nwpc_data_tool.verify.data import get_message
from nwpc_data_tool.verify.plev.eccodes import calculate_plev_stats
本文使用 nwpc-data 库封装 eccodes 的函数 nwpc_data.grib.eccodes.load_message_from_file 加载要素场。
之前介绍的检验指标计算已整合到 nwpc-data-tool 库中。
调用 calculate_plev_stats 函数会返回包含指标的 pandas.DataFrame 对象。
数据
重要提示:本文数据来自其他工具。
某个试验的数据目录,包含 2016 年 7 月 1 日至 7 月 31 日的预报结果
forecast_root_dir = "/some/path/to/CTL/"
analysis_root_dir = "/some/path/to/CTL/"
climate_root_dir = "/some/path/to/obdata/cmean"
参数
预报时效
forecast_hours = np.arange(0, 193, 24)
forecast_hours
array([ 0, 24, 48, 72, 96, 120, 144, 168, 192])
要素名称
parameters = ["gh", "t", "u", "v"]层次,单位 hPa
levels = [1000, 850, 700, 500, 400, 300, 250, 100, 70, 50, 10, 5, 3, 1]区域,名称和范围
regions = [
    {
        "name": "NHEM",
        "domain": [20, 90, 0, 360],
    },
    {
        "name": "SHEM",
        "domain": [-90, -20, 0, 360],
    },
    {
        "name": "EASI",
        "domain": [15, 65, 70, 145],
    },
    {
        "name": "TROP",
        "domain": [-20, 20, 0, 360],
    },
    {
        "name": "GLOB",
        "domain": [-90, 90, 0, 360],
    },
]
时次列表
start_hours = pd.date_range(
    "2016-07-01 12:00",
    "2016-07-31 12:00",
    freq="D"
)
start_hours
DatetimeIndex(['2016-07-01 12:00:00', '2016-07-02 12:00:00',
'2016-07-03 12:00:00', '2016-07-04 12:00:00',
'2016-07-05 12:00:00', '2016-07-06 12:00:00',
'2016-07-07 12:00:00', '2016-07-08 12:00:00',
'2016-07-09 12:00:00', '2016-07-10 12:00:00',
'2016-07-11 12:00:00', '2016-07-12 12:00:00',
'2016-07-13 12:00:00', '2016-07-14 12:00:00',
'2016-07-15 12:00:00', '2016-07-16 12:00:00',
'2016-07-17 12:00:00', '2016-07-18 12:00:00',
'2016-07-19 12:00:00', '2016-07-20 12:00:00',
'2016-07-21 12:00:00', '2016-07-22 12:00:00',
'2016-07-23 12:00:00', '2016-07-24 12:00:00',
'2016-07-25 12:00:00', '2016-07-26 12:00:00',
'2016-07-27 12:00:00', '2016-07-28 12:00:00',
'2016-07-29 12:00:00', '2016-07-30 12:00:00',
'2016-07-31 12:00:00'],
dtype='datetime64[ns]', freq='D')
计算
对于时间段 (start_hours) 内的每个时间点,计算不同起报时次 (forecast_date) 预报该时间点的检验指标,每个起报时次在该点对应的不同预报时效 (forecast_hour)。
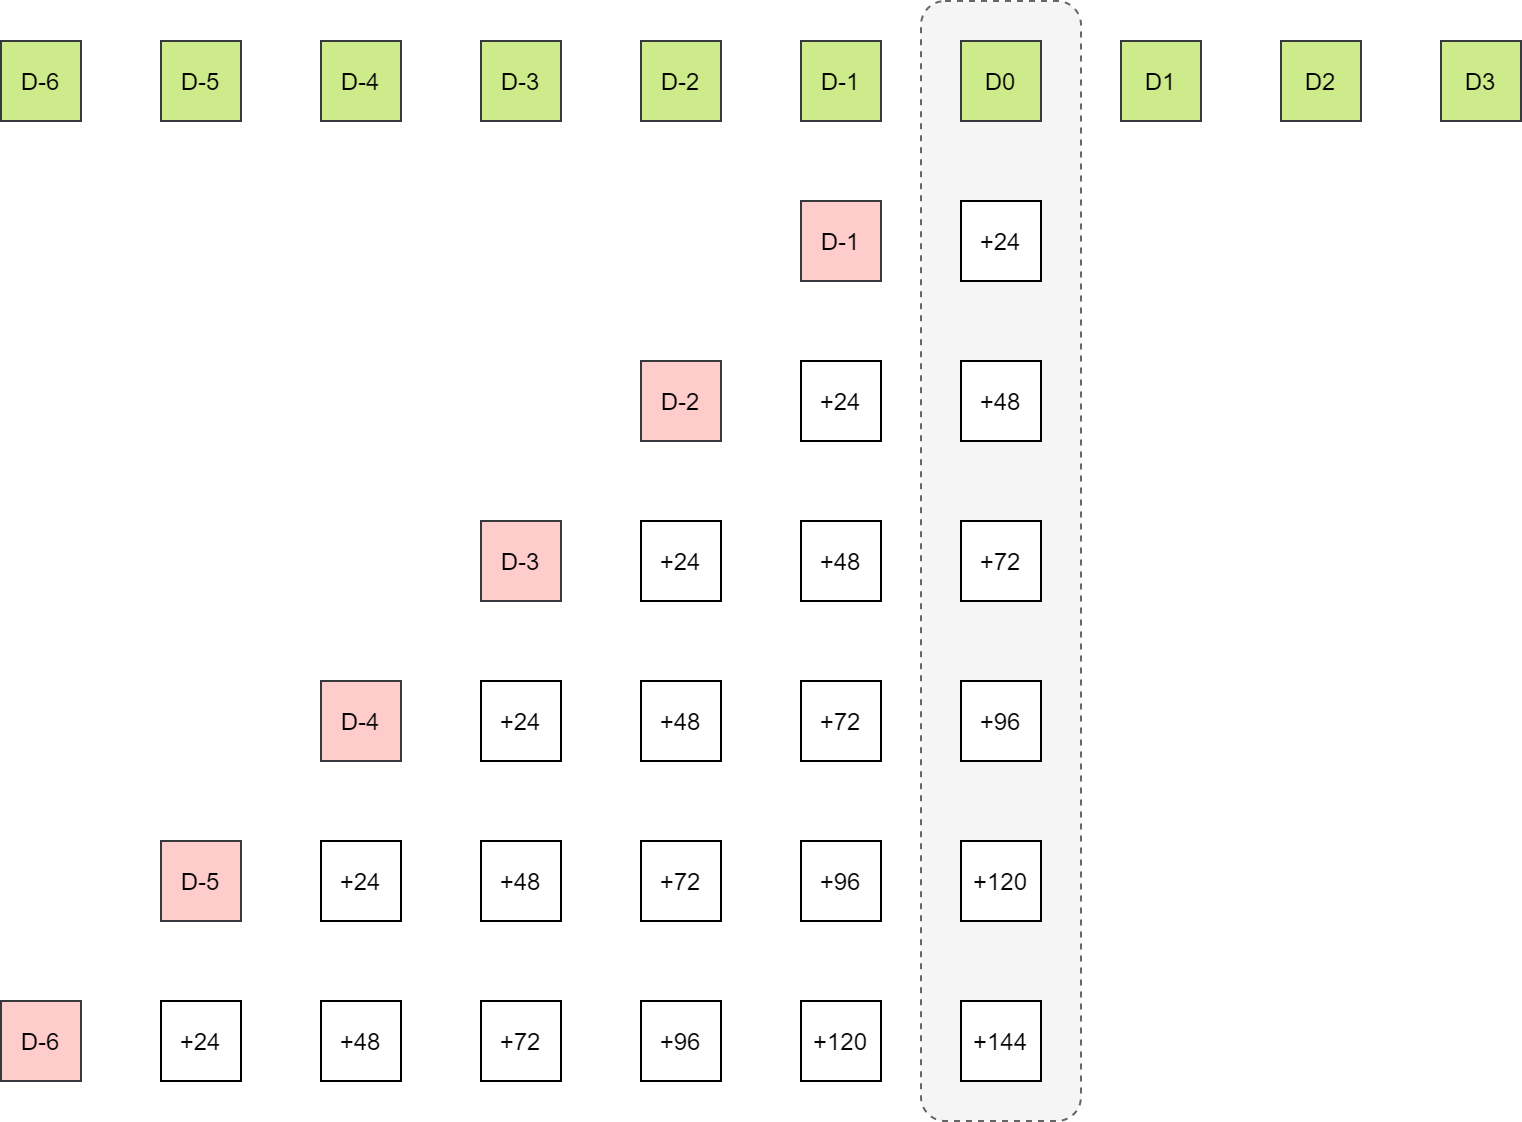
为不同变量 (parameter)、不同层次 (level)、不同区域 (region) 分别计算检验指标。
from tqdm.notebook import tqdm

dfs = []
# 时间点
for current_date in tqdm(start_hours):
    print(current_date)
    # 每个时间点的分析场和预报场相同
    analysis_data_path = pathlib.Path(
        analysis_root_dir,
        f"pgbf000.grapes.{current_date.strftime('%Y%m%d%H')}",
    )

    climate_data_path = pathlib.Path(
        climate_root_dir,
        f"cmean_1d.1959{current_date.strftime('%m%d')}",
    )

    df_list = []

    # 预报时效
    for current_forecast_hour in forecast_hours:
        # print(current_forecast_hour)
        hour_start_time = pd.Timestamp.now()

        forecast_date = current_date - pd.Timedelta(hours=current_forecast_hour)

        forecast_data_path = pathlib.Path(
            forecast_root_dir,
            f"pgbf{current_forecast_hour:03d}.grapes.{forecast_date.strftime('%Y%m%d%H')}"
        )

        # 跳过没有数据的时效
        if (not forecast_data_path.exists()) or (not analysis_data_path.exists()):
            continue

        # 要素
        for parameter in parameters:
            # 层次
            for level in levels:
                # 载入要素场
                analysis_message = get_message(
                    analysis_data_path,
                    parameter=parameter,
                    level=level,
                )
                analysis_array = eccodes.codes_get_double_array(analysis_message, "values").reshape([121, 240])
                eccodes.codes_release(analysis_message)

                climate_message = get_message(
                    climate_data_path,
                    parameter=parameter,
                    level=level,
                )
                climate_array = eccodes.codes_get_double_array(climate_message, "values").reshape([121, 240])
                eccodes.codes_release(climate_message)

                forecast_message = get_message(
                    forecast_data_path,
                    parameter=parameter,
                    level=level,
                )
                forecast_array = eccodes.codes_get_double_array(forecast_message, "values").reshape([121, 240])
                eccodes.codes_release(forecast_message)

                # 区域
                for area in regions:
                    domain = area["domain"]
                    region = area["name"]

                    df = calculate_plev_stats(
                        forecast_array=forecast_array,
                        analysis_array=analysis_array,
                        climate_array=climate_array,
                        domain=domain,
                    )
                    # 增加元信息
                    df["forecast_hour"] = current_forecast_hour
                    df["variable"] = parameter
                    df["level"] = level
                    df["region"] = region
                    df_list.append(df)

        hour_end_time = pd.Timestamp.now()

    if len(df_list) == 0:
        continue

    # 将不同时效结果合并
    df = pd.concat(df_list, ignore_index=True)

    # 设置多级索引
    df = df.set_index(["forecast_hour", "variable", "level", "region"])

    dfs.append({
        "start_hour": current_date,
        "data": df,
    })
探索数据
选择 7 月 17 日 12 时次的检验指标
dfs[15]["start_hour"]Timestamp('2016-07-17 12:00:00', freq='D')
转换为 xarray.DataSet 对象
data = dfs[15]["data"].to_xarray()
data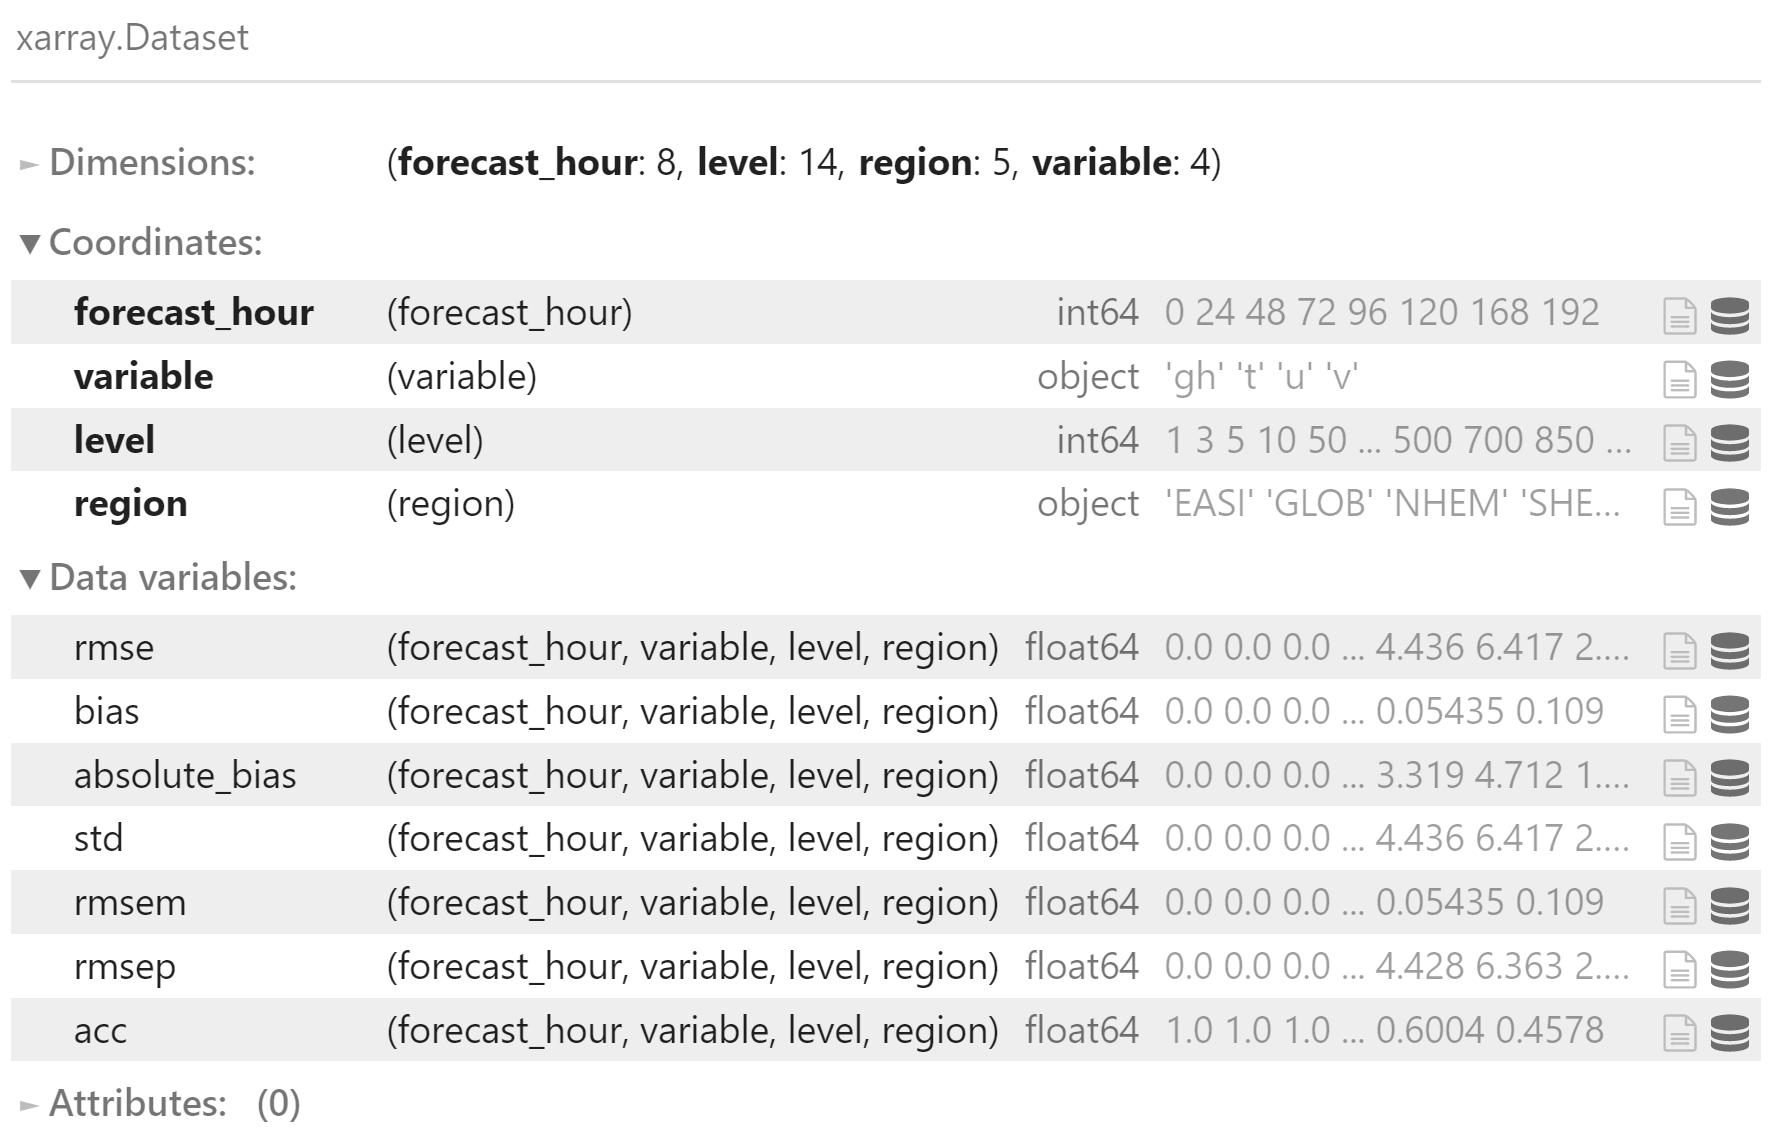
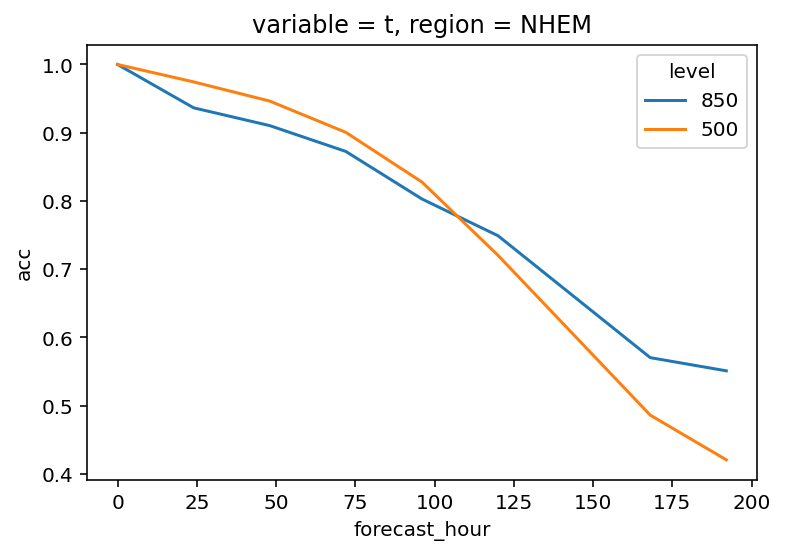
绘制北半球 850hPa 和 500hPa 温度场的 ACC
data.sel(
    variable="t",
    level=[850, 500],
    region="NHEM"
)["acc"].plot(
    hue="level"
);
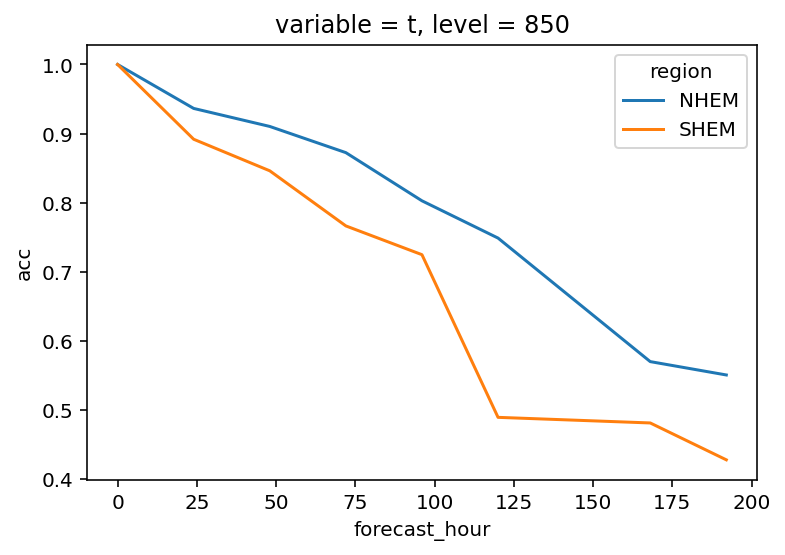
绘制北半球和南半球 850hPa 温度场的 ACC
data.sel(
    variable="t",
    level=850,
    region=["NHEM", "SHEM"],
)["acc"].plot(
    hue="region"
);
合并数据
计算检验指标时会忽略缺失数据,尤其是前几天的预报会缺少长时效的预报数据。
为了让每个时次的检验指标数据保持一致,需要补充缺失的数据。
本文利用多级索引和 DataFrame 的合并方法,构造符合要求的数据。
创建多级索引
将描述信息(时效、要素名、层次、区域)当成索引,方便后续进行数据合并。
region_names = [region["name"] for region in regions]

index = pd.MultiIndex.from_product(
    [forecast_hours, parameters, levels, region_names],
    names=['forecast_hour', 'variable', 'level', 'region'])
index
MultiIndex([( 0, 'gh', 1000, 'NHEM'),
( 0, 'gh', 1000, 'SHEM'),
( 0, 'gh', 1000, 'EASI'),
( 0, 'gh', 1000, 'TROP'),
( 0, 'gh', 1000, 'GLOB'),
( 0, 'gh', 850, 'NHEM'),
( 0, 'gh', 850, 'SHEM'),
( 0, 'gh', 850, 'EASI'),
( 0, 'gh', 850, 'TROP'),
( 0, 'gh', 850, 'GLOB'),
...
(192, 'v', 3, 'NHEM'),
(192, 'v', 3, 'SHEM'),
(192, 'v', 3, 'EASI'),
(192, 'v', 3, 'TROP'),
(192, 'v', 3, 'GLOB'),
(192, 'v', 1, 'NHEM'),
(192, 'v', 1, 'SHEM'),
(192, 'v', 1, 'EASI'),
(192, 'v', 1, 'TROP'),
(192, 'v', 1, 'GLOB')],
names=['forecast_hour', 'variable', 'level', 'region'], length=2520)
生成空的 DataFrame,用于下一步合并
df_index = pd.DataFrame(index=index)
df_index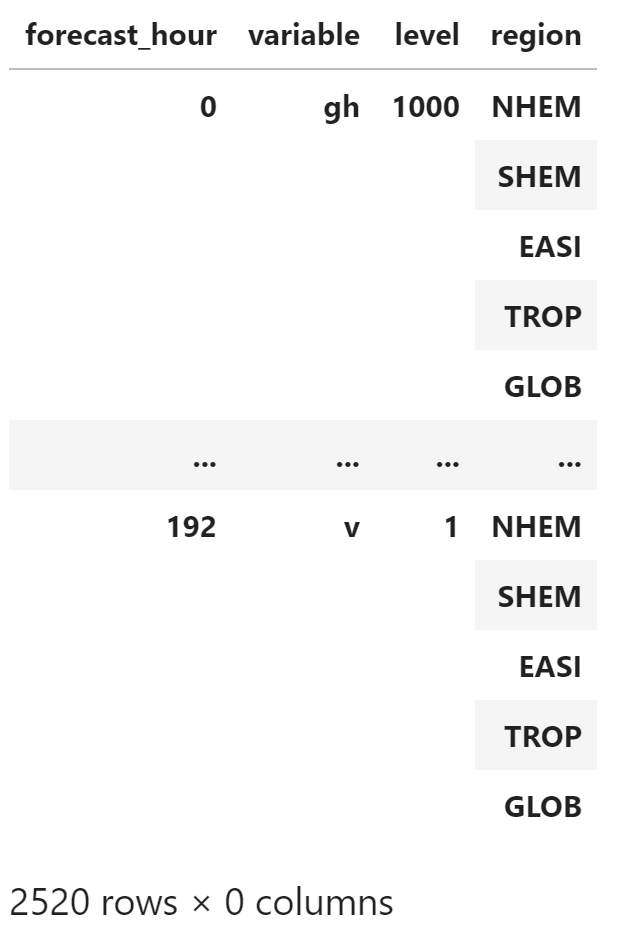
合并
第一个示例
合并第一个日期(即 2016 年 7 月 1 日)的检验指标,因为缺少之前时次的数据,所以结果中仅有 forecat_hour = 0 的数据。
df_test = dfs[0]["data"].copy()
df_test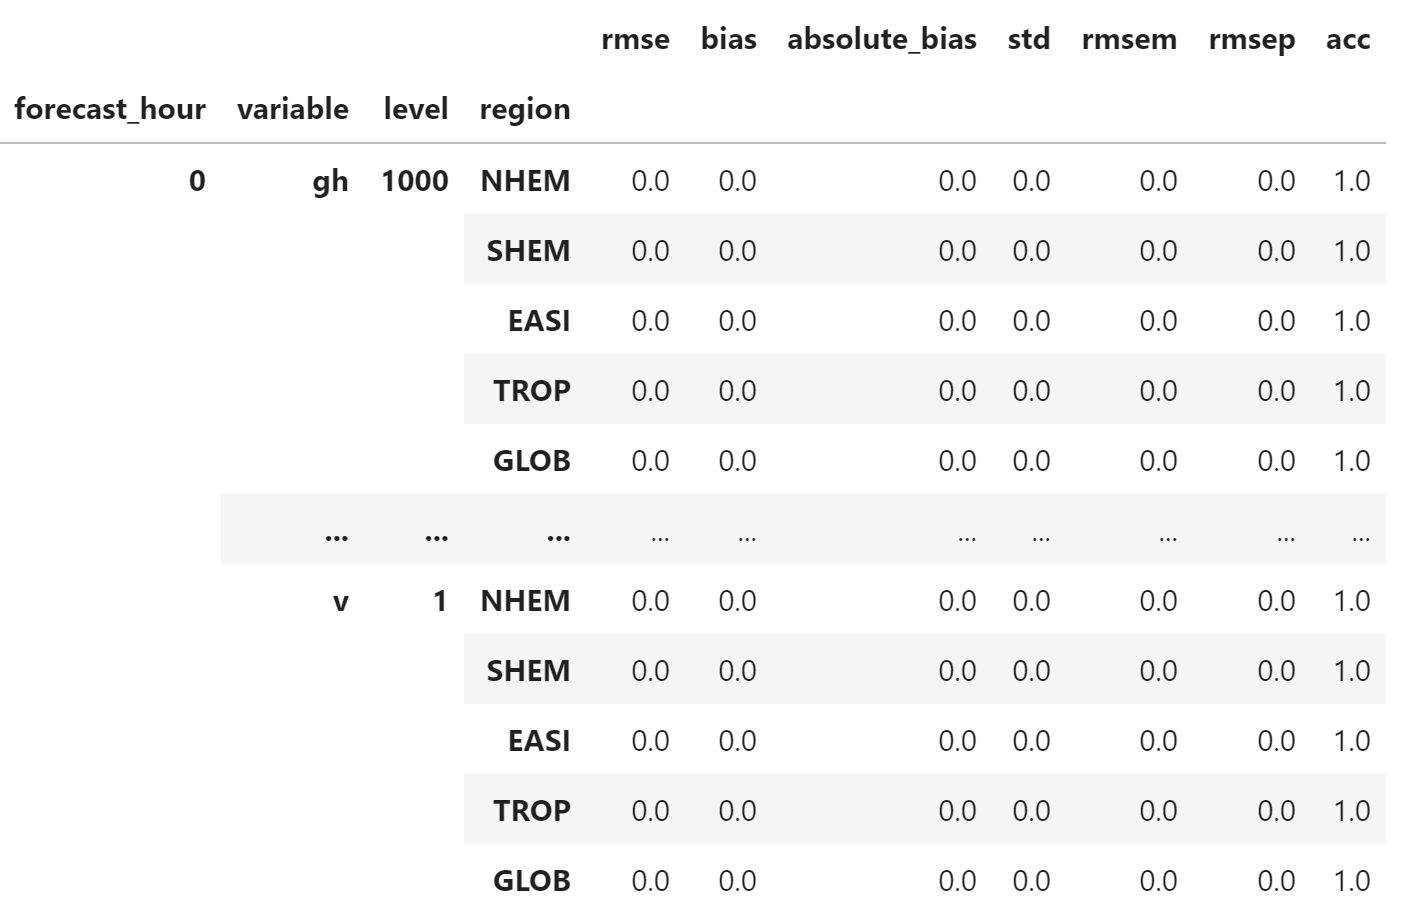
与 df_index 合并,可以看到,所有空缺的值都设置为 np.NaN
merged_df = pd.merge(
    df_index, df_test,
    left_index=True,
    right_index=True,
    how="left"
)
merged_df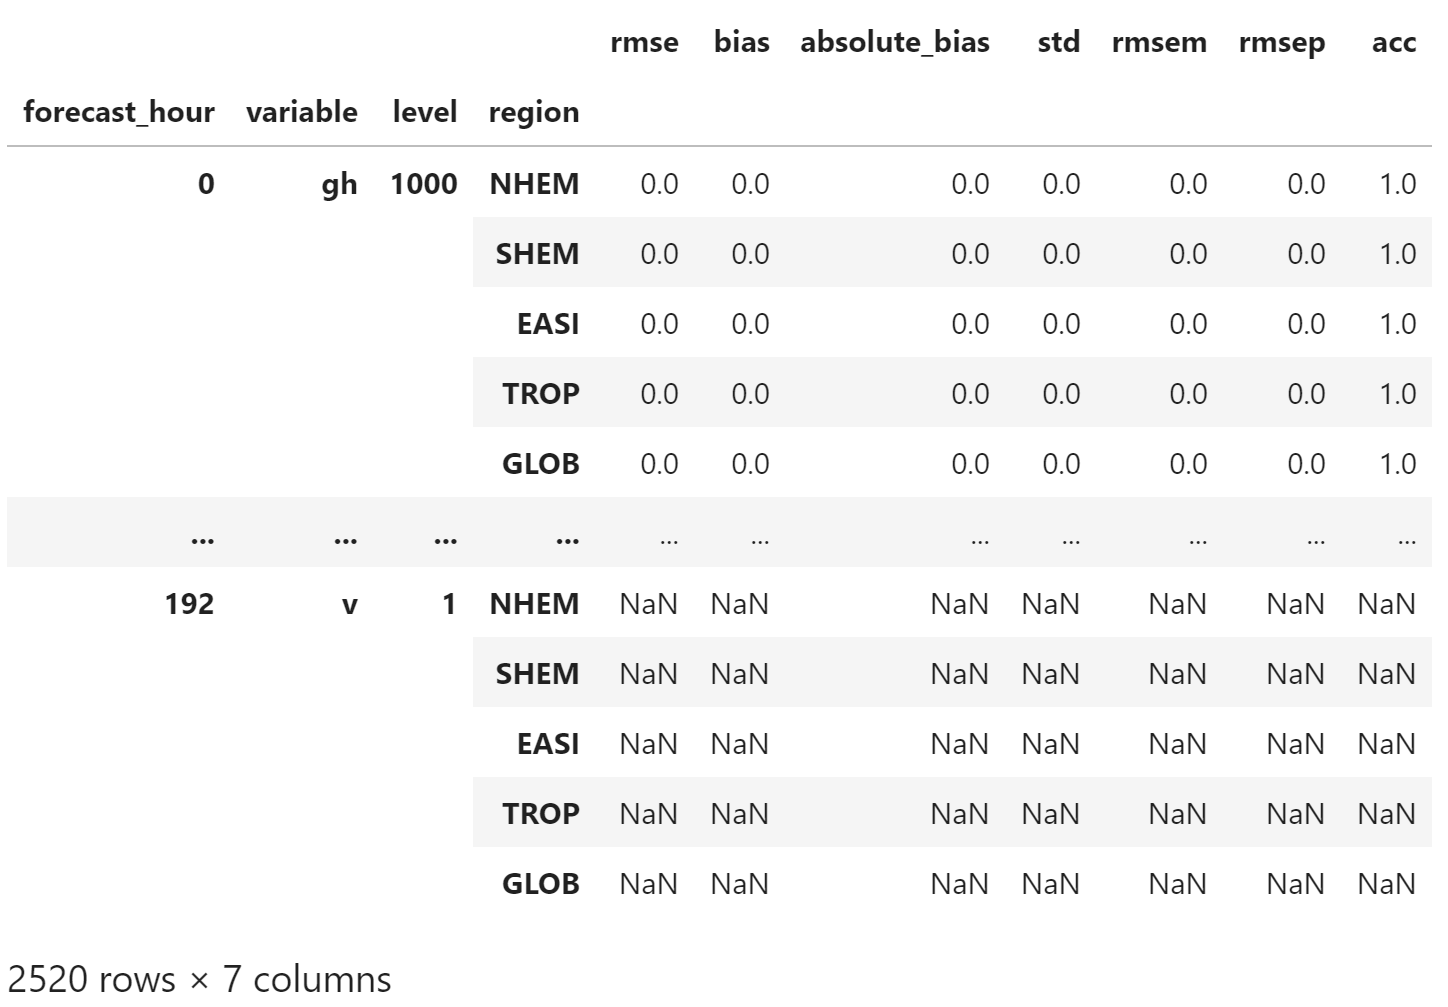
处理缺失值,为了方便持久化,使用 -999.0 填充缺失值 np.NaN
merged_df = merged_df.fillna(-999.0)
merged_df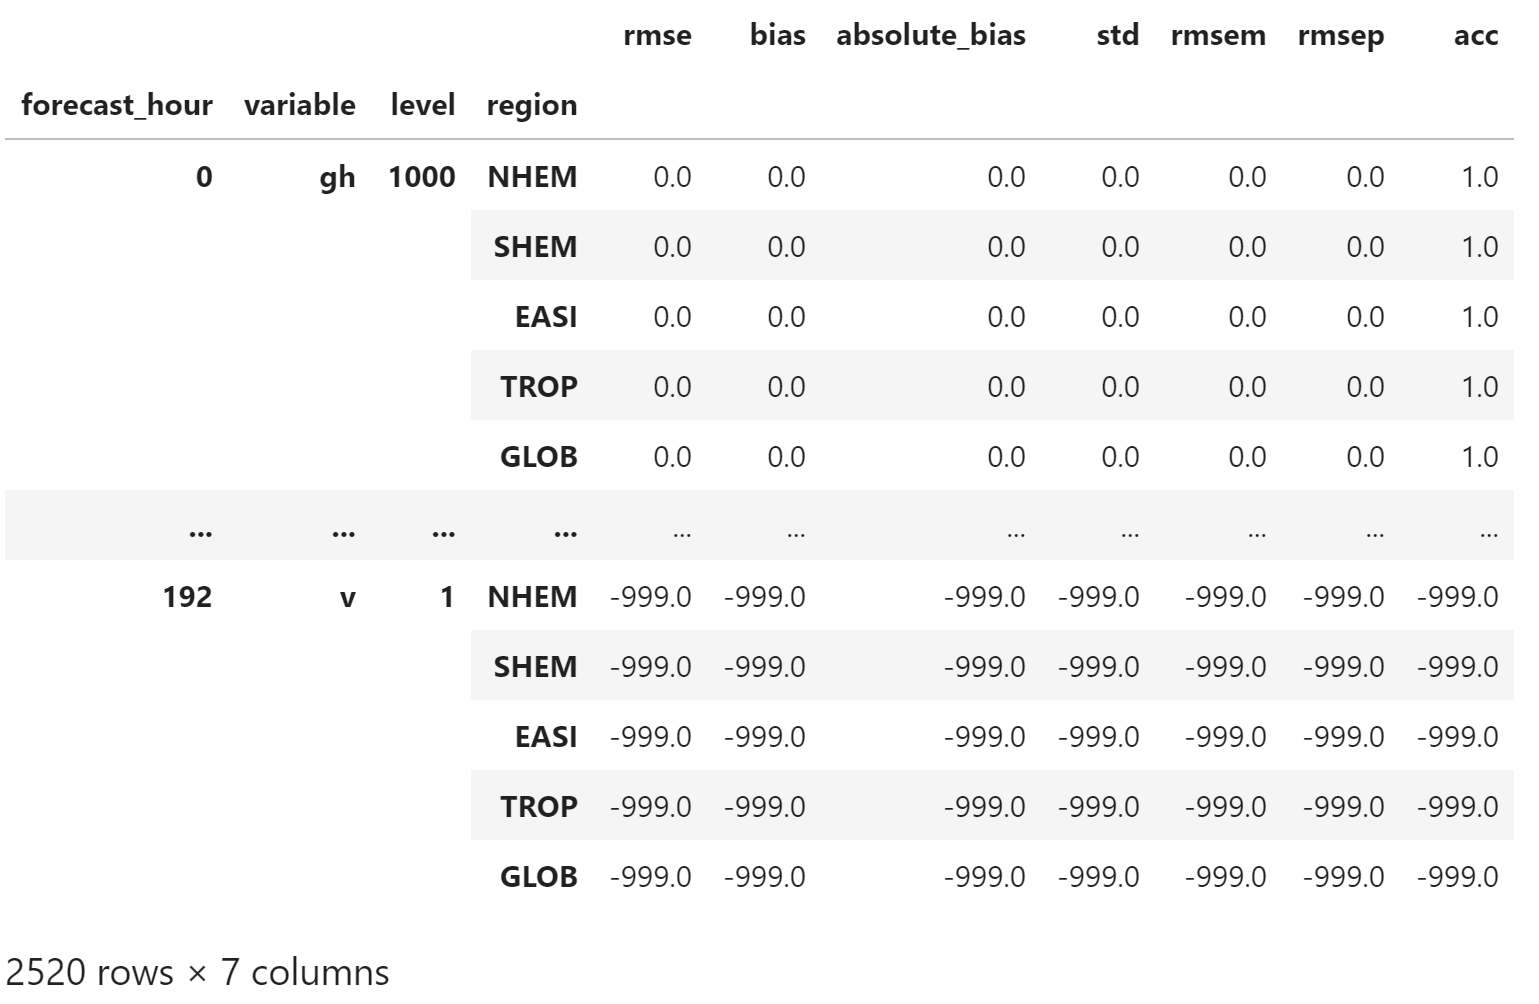
另一个示例
选择第 6 个数据(即 2016 年 7 月 6 日),仅有最多 120 小时前的预报
start_hour = dfs[5]["start_hour"]
start_hour
Timestamp('2016-07-06 12:00:00', freq='D')
df_test = dfs[5]["data"].copy()
df_test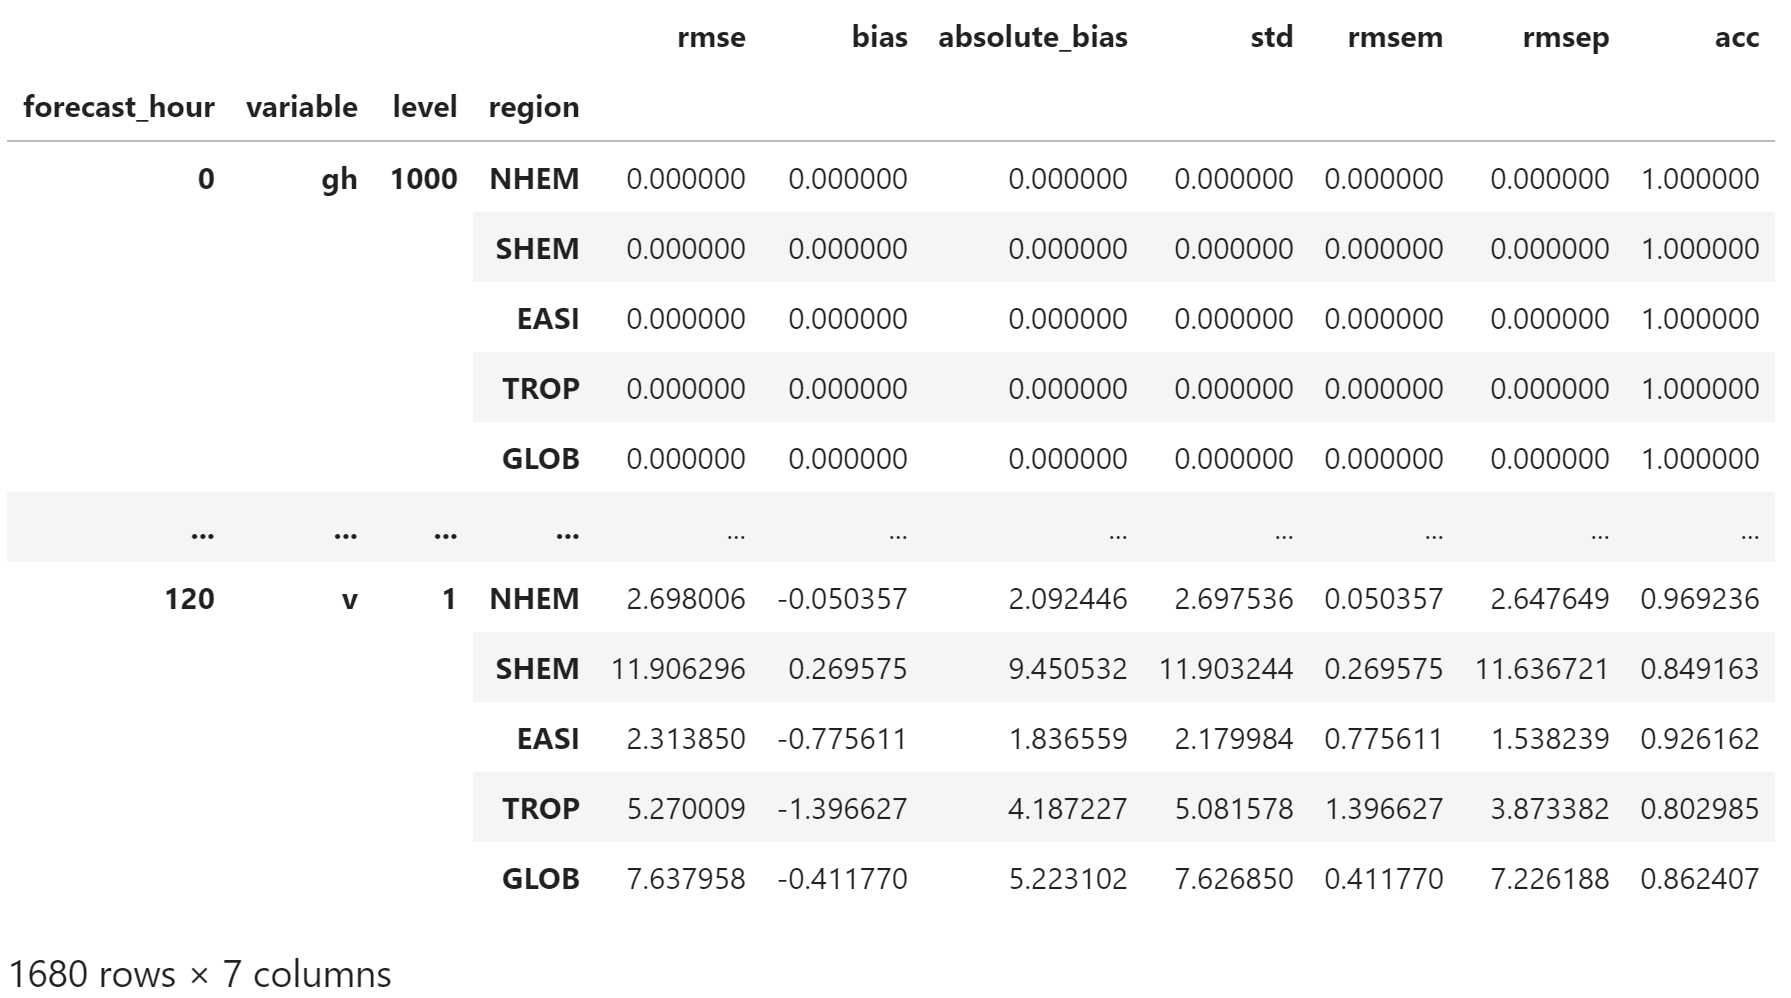
合并数据,可以看到 120 小时后的统计指标均被填充为 -999.0
merged_df = pd.merge(
    df_index, df_test,
    left_index=True,
    right_index=True,
    how="left"
).fillna(-999.0)
merged_df.loc[slice(120, 192), "gh", 1000, "GLOB"]
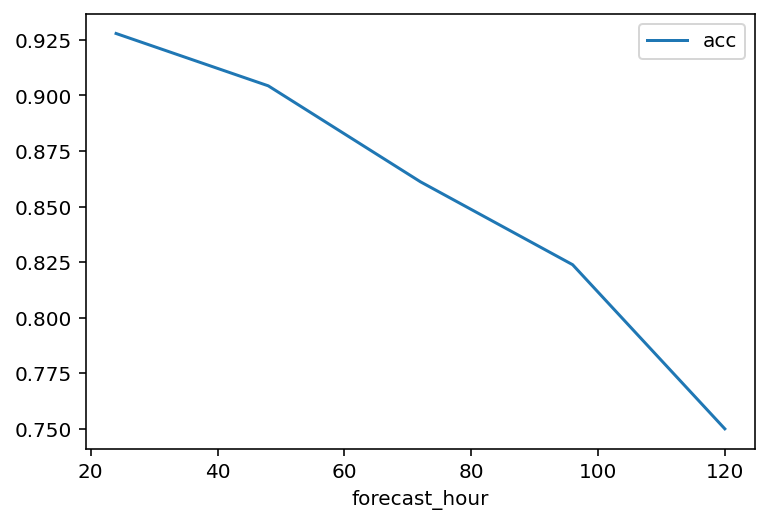
绘制 850hPa 北半球温度场的 ACC
merged_df.loc[slice(24,120), "t", 850, "NHEM"]["acc"].reset_index().plot(
    x="forecast_hour",
    y="acc",
);
持久化
将检验结果保存为 CSV 文件,用于后续计算画图程序。
使用 reset_index 将索引恢复为数据列
plain_merged_df = merged_df.reset_index()
plain_merged_df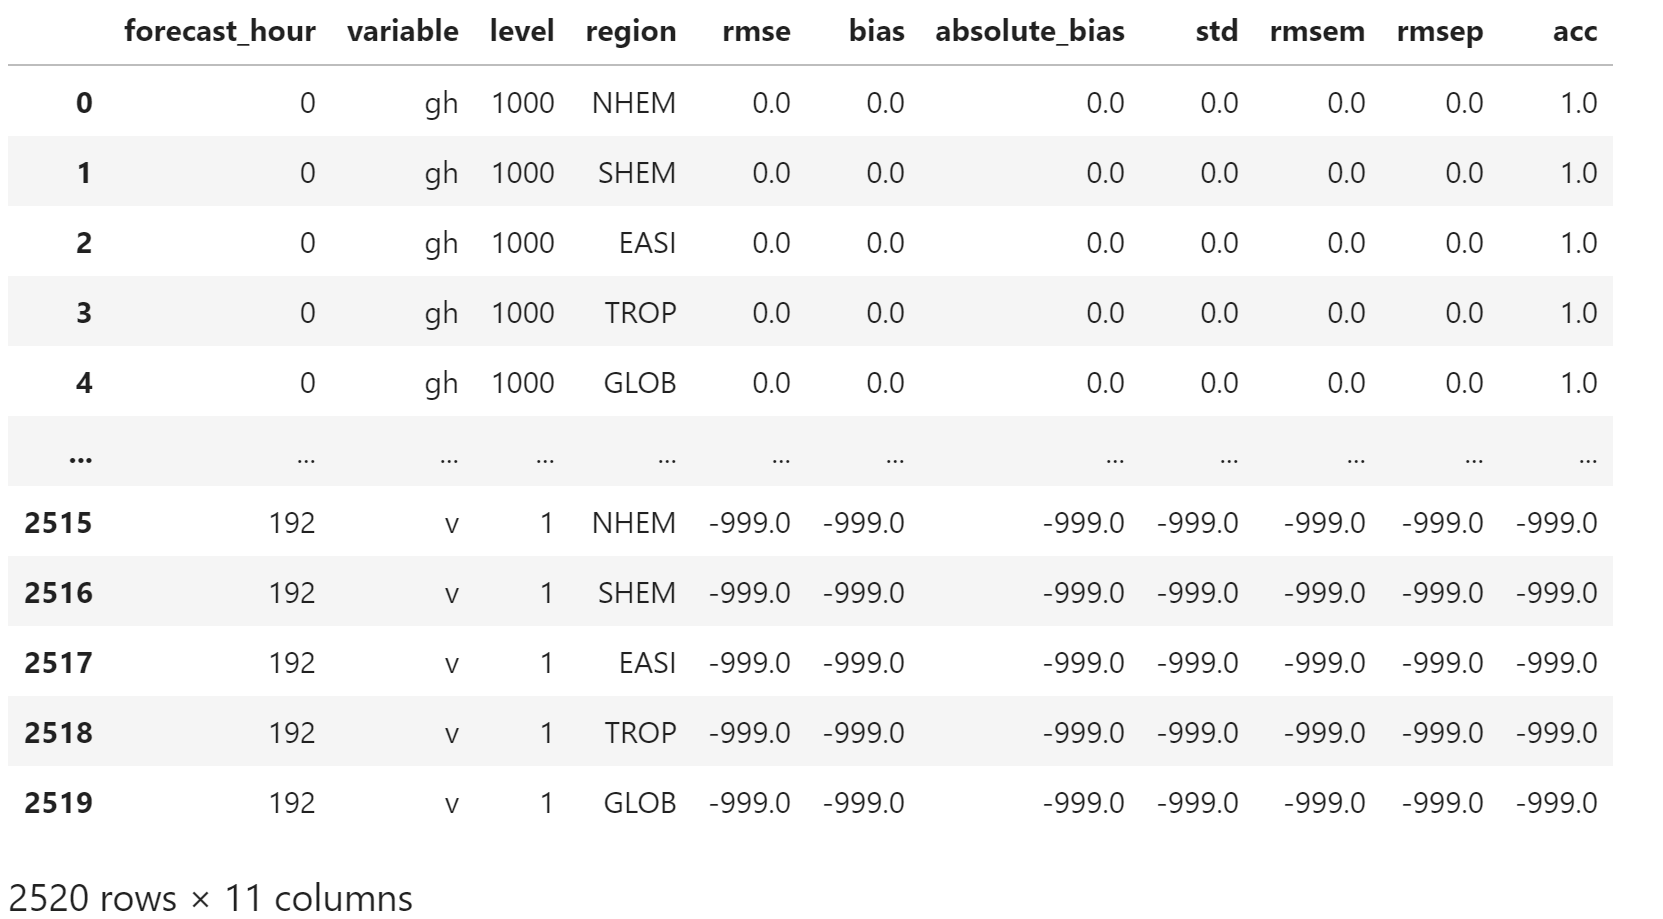
使用 to_csv 将 pandas.DataFrame 保存成 CSV 文件
plain_merged_df.to_csv(
    f"stat.{start_hour.strftime('%Y%m%d')}.csv",
    index=False,
    float_format="%.6f",
)
生成的 CSV 文件如下所示
forecast_hour,variable,level,region,rmse,bias,absolute_bias,std,rmsem,rmsep,acc
0,gh,1000,NHEM,0.000000,0.000000,0.000000,0.000000,0.000000,0.000000,1.000000
0,gh,1000,SHEM,0.000000,0.000000,0.000000,0.000000,0.000000,0.000000,1.000000
0,gh,1000,EASI,0.000000,0.000000,0.000000,0.000000,0.000000,0.000000,1.000000
...
24,gh,1,NHEM,81.950479,50.974859,60.691194,64.167319,50.974859,30.975620,0.965435
24,gh,1,SHEM,96.274956,43.640889,80.783972,85.815732,43.640889,52.634066,0.985570
24,gh,1,EASI,118.847585,105.442324,105.517215,54.833063,105.442324,13.405261,0.831921
...
192,v,1,EASI,-999.000000,-999.000000,-999.000000,-999.000000,-999.000000,-999.000000,-999.000000
192,v,1,TROP,-999.000000,-999.000000,-999.000000,-999.000000,-999.000000,-999.000000,-999.000000
192,v,1,GLOB,-999.000000,-999.000000,-999.000000,-999.000000,-999.000000,-999.000000,-999.000000
保存所有时次
for item in dfs:
    start_hour = item["start_hour"]
    df = item["data"]
    merged_df = pd.merge(
        df_index, df,
        left_index=True,
        right_index=True,
        how="left"
    ).fillna(-999.0)
    plain_merged_df = merged_df.reset_index()
    plain_merged_df.to_csv(
        f"stat/stat.{start_hour.strftime('%Y%m%d')}.csv",
        index=False,
        float_format="%.6f",
    )
验证结果
与其他工具生成的检验结果进行对比,验证本文计算生成的检验指标是否可信。
选择 7 月 20 日 12 时次的数据。
原始检验指标数据
orig_file_path = "orig-stat/stats.2016072012"其他工具输出的文件类似等宽文本文件
LEADTIME      VARIABLES     PLEVS     REGION    ACC       RMSE      BIAS       ABIAS      STD      RMSEM      RMSEP
  0             gh          1000       NHEM       1.000000       0.000       0.000       0.000       0.000       0.000       0.000
  0             gh          1000       SHEM       1.000000       0.000       0.000       0.000       0.000       0.000       0.000
  0             gh          1000       EASI       1.000000       0.000       0.000       0.000       0.000       0.000       0.000
...
144             gh           300       NHEM       0.716312      68.867     -14.208      47.758      67.386      14.208      54.659
144             gh           300       SHEM       0.904470      76.519      -6.414      56.738      76.249       6.414      70.105
144             gh           300       EASI       0.685752      41.890
...
使用 read_csv 函数载入,用 \s+ 作为分隔符
orig_df = pd.read_csv(
    orig_file_path,
    sep="\s+",
)
orig_df[1000:1010]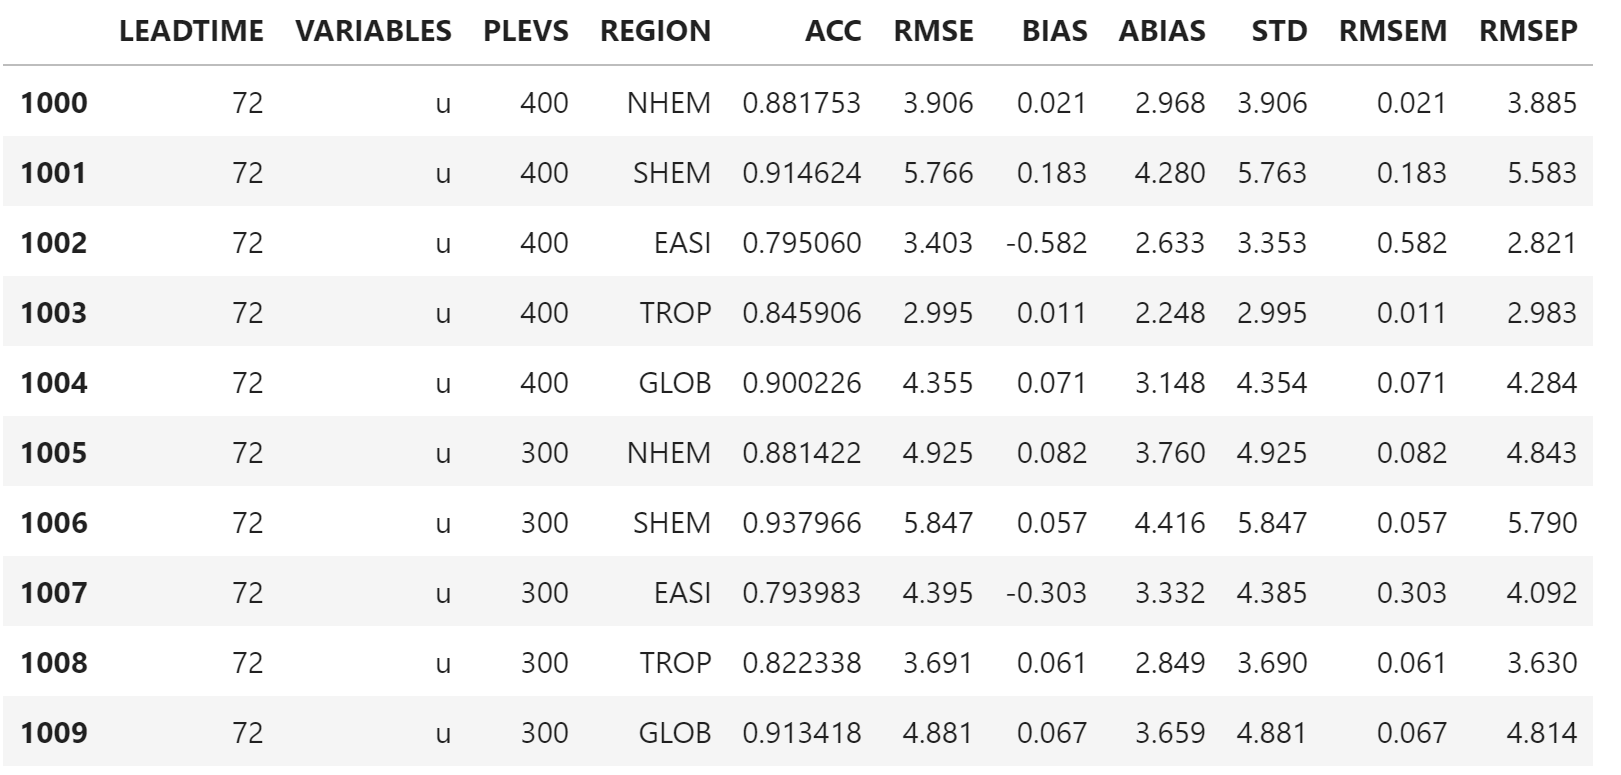
修改列名
orig_table = orig_df.rename(columns={
    "LEADTIME": "forecast_hour",
    "VARIABLES": "variable",
    "PLEVS": "level",
    "REGION": "region",
    "ACC": "acc",
    "RMSE": "rmse",
    "BIAS": "bias",
    "ABIAS": "absolute_bias",
    "STD": "std",
    "RMSEM": "rmsem",
    "RMSEP": "rmsep",
})
orig_table.head()
恢复缺失值
orig_table[orig_table == -999.0] = np.nan
orig_table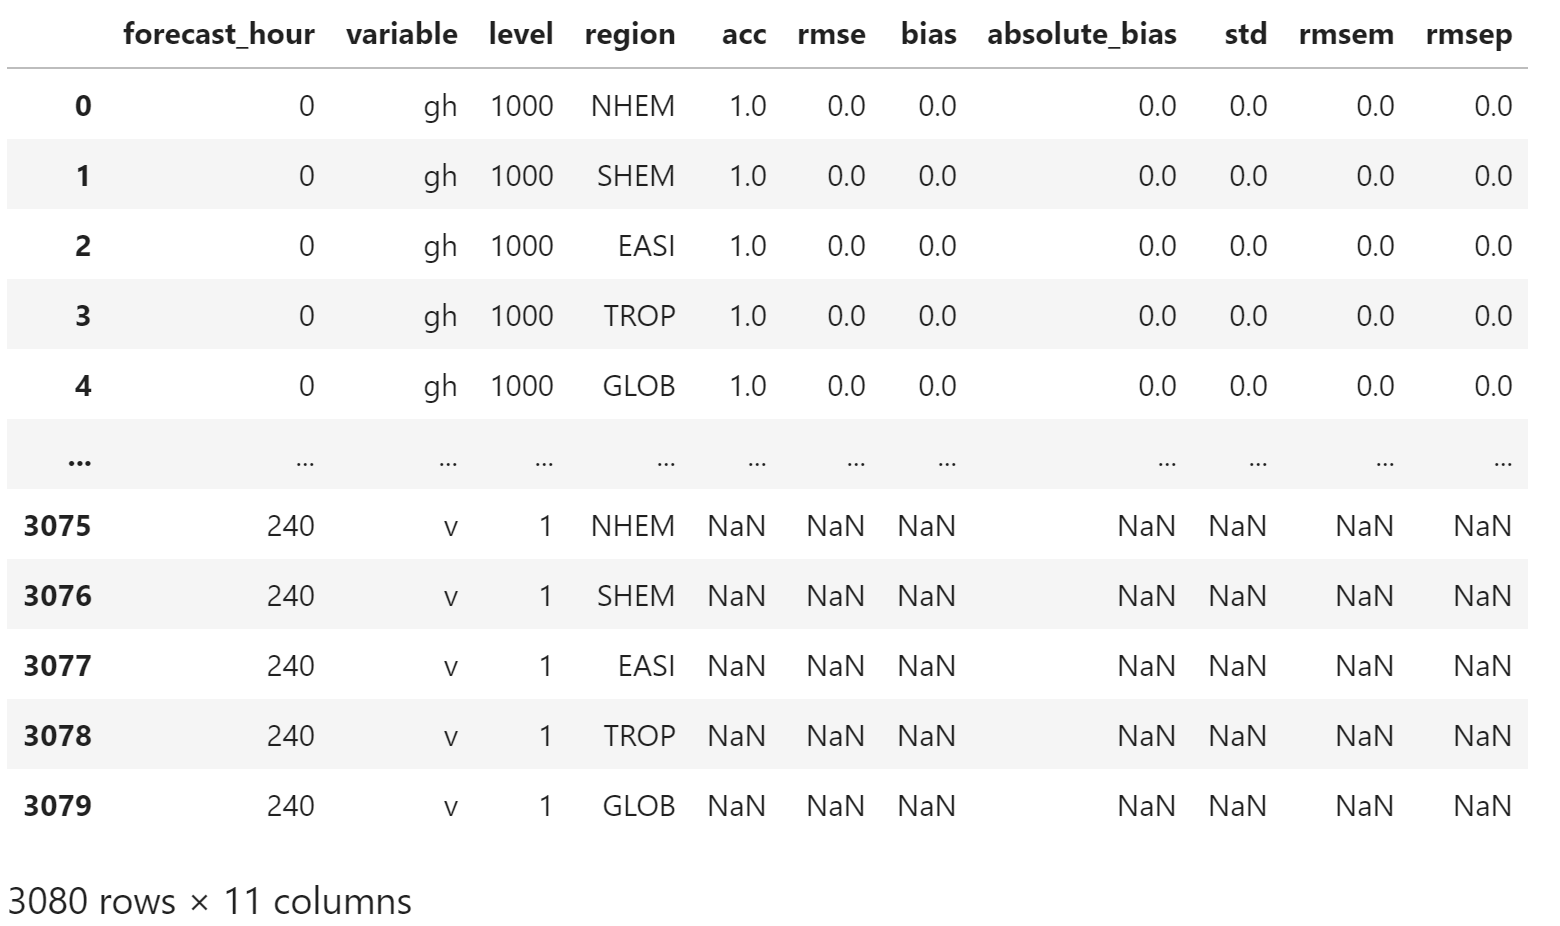
删掉含有缺失值的列
orig_table.dropna(inplace=True)
orig_table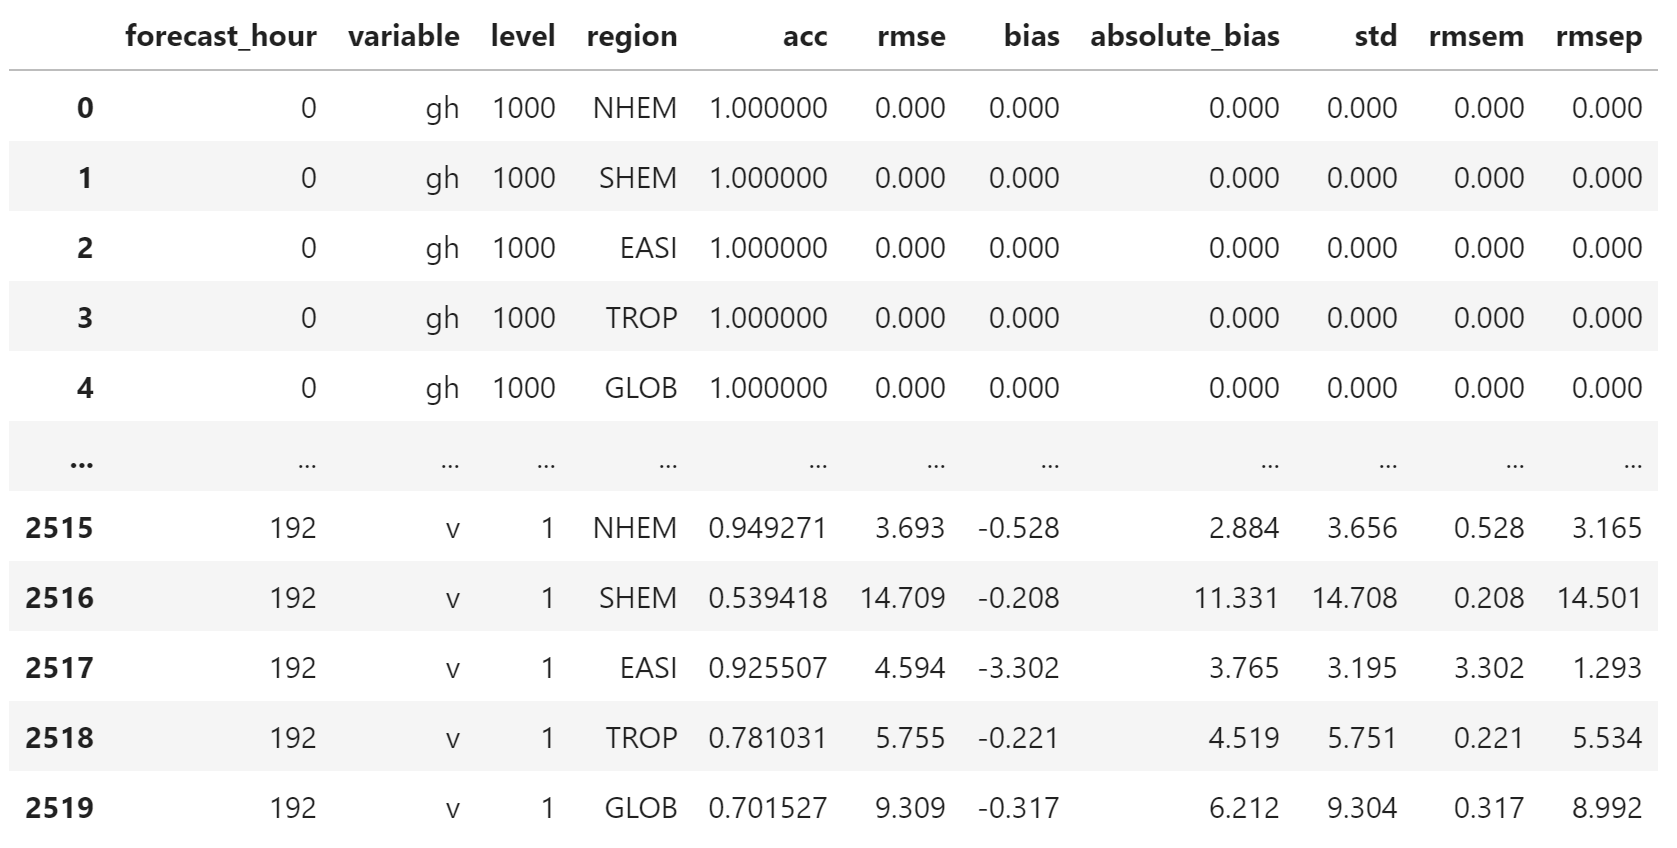
修改浮点数精度,便于后续比较大小
orig_table[["rmse", "bias", "absolute_bias", "std", "rmsem","rmsep"]] \
    = current_df[["rmse", "bias", "absolute_bias", "std", "rmsem","rmsep"]].applymap(lambda x: np.round(x, 3))
新数据
current_file_path = "stat/stat.20160720.csv"
current_df = pd.read_csv(current_file_path)
current_df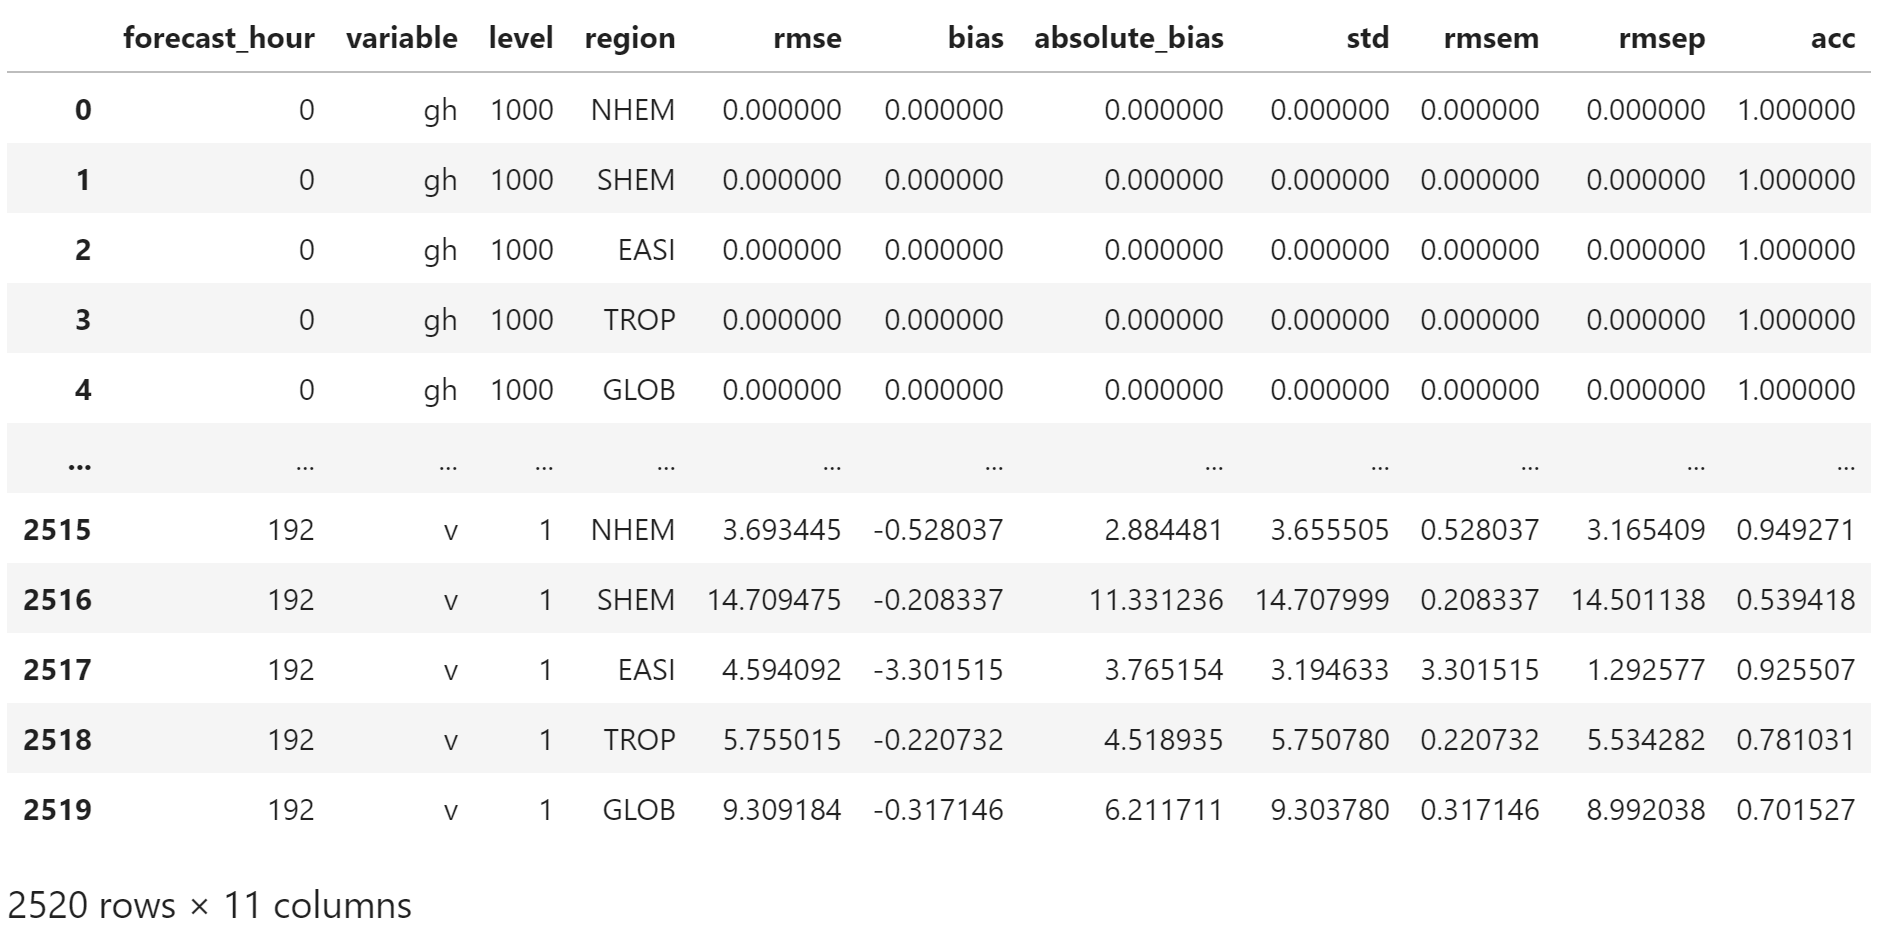
删掉缺失值,实际上数据中没有缺失值。
current_df.dropna(inplace=True)修改浮点数精度
current_df[["rmse", "bias", "absolute_bias", "std", "rmsem","rmsep"]] \
    = current_df[["rmse", "bias", "absolute_bias", "std", "rmsem","rmsep"]].applymap(lambda x: np.round(x, 3))
current_df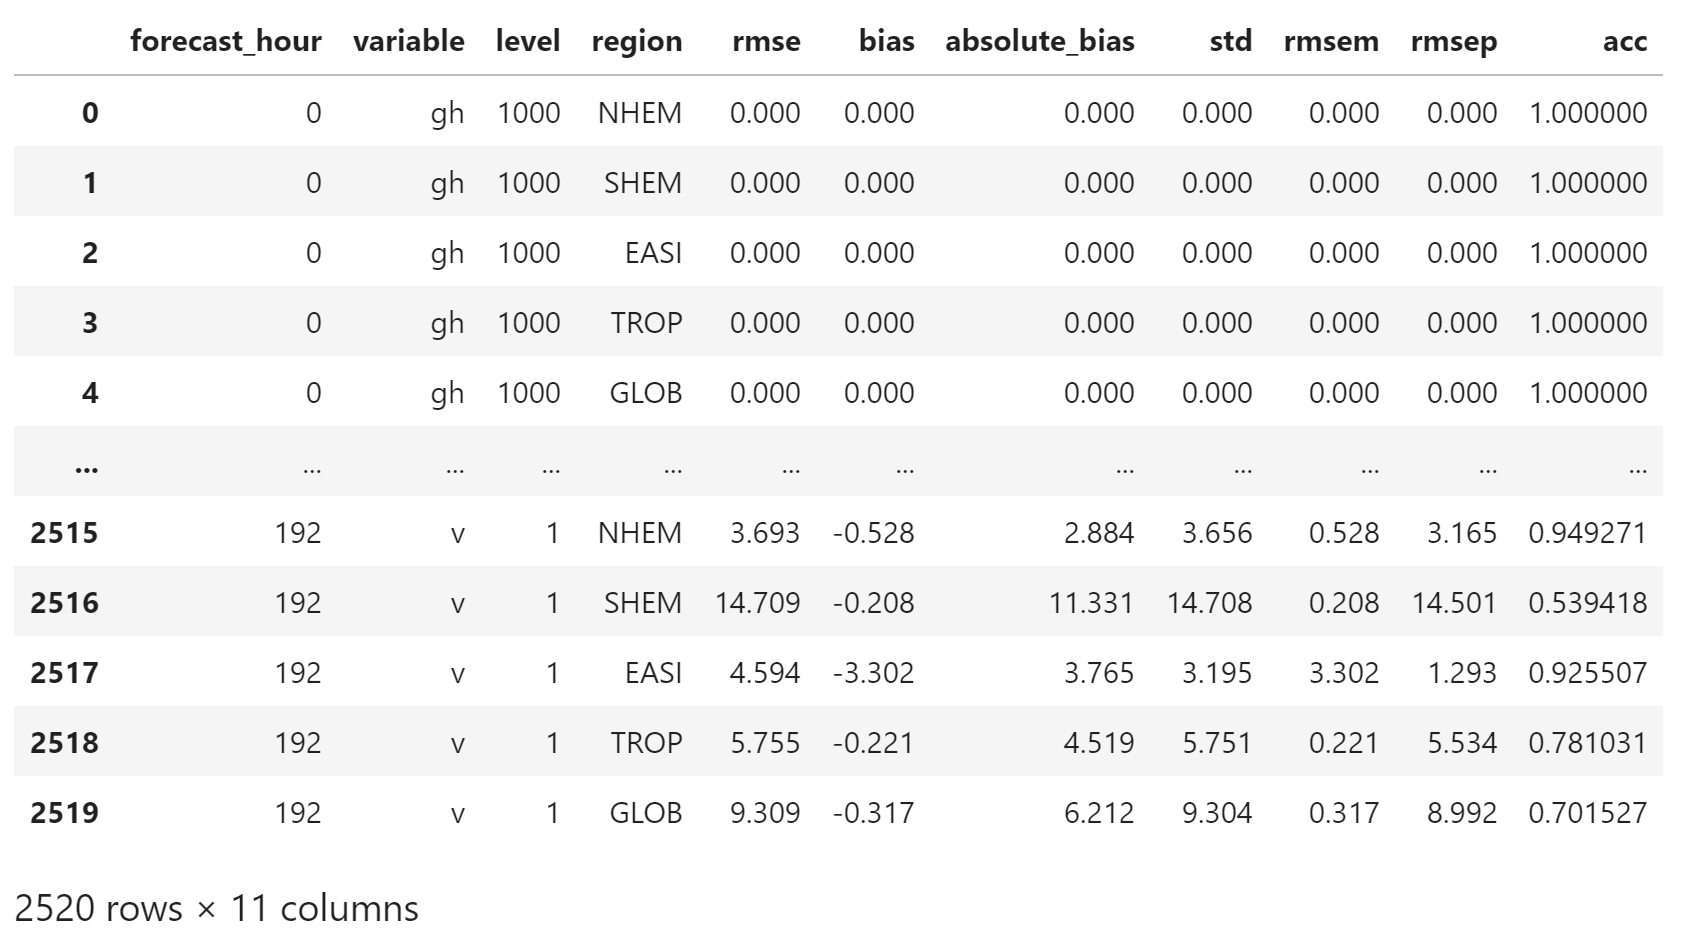
对比
使用 equals 方法比较两个 DataFrame 是否相等
current_df[["acc", "rmse", "bias", "absolute_bias", "std", "rmsem","rmsep"]].equals(
    orig_table[["acc", "rmse", "bias", "absolute_bias", "std", "rmsem","rmsep"]]
)
True
也可以对两个数据作差
diff_total = (
    current_df[["acc", "rmse", "bias", "absolute_bias", "std", "rmsem","rmsep"]]
    -
    orig_table[["acc", "rmse", "bias", "absolute_bias", "std", "rmsem","rmsep"]]
)
diff_total.describe()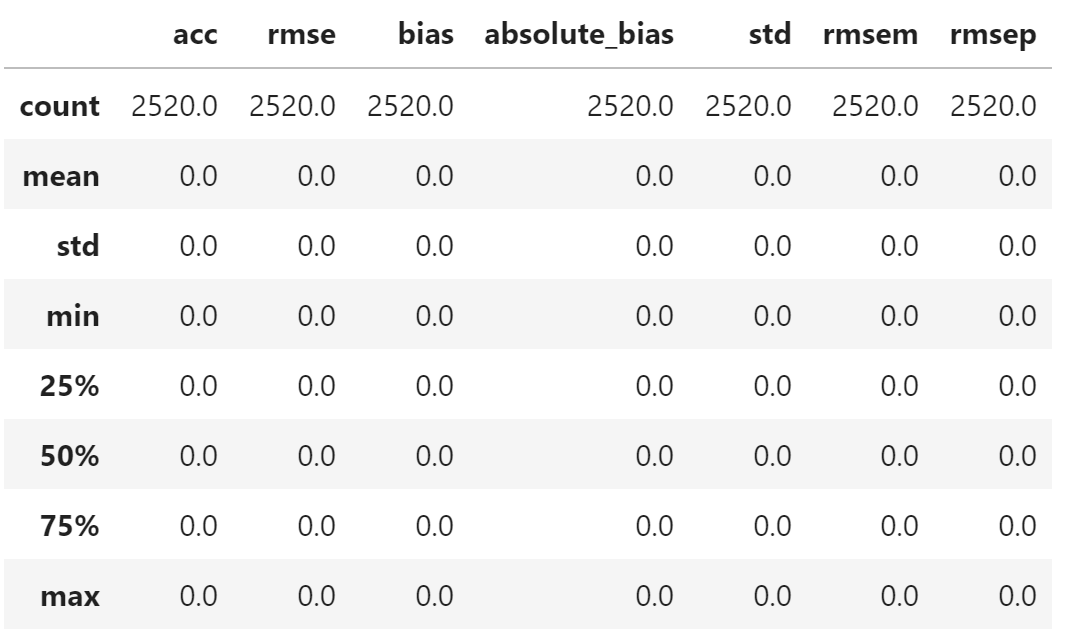
从输出看,diff_total 是全 0 矩阵,说明两个数据是相同的。
即,本文得到的检验指标与其他工具计算的结果完全相同。
