使用 xarray 计算单个要素场的基本检验指标
目录
上一篇文章《计算等压面要素场的基本检验指标》中介绍了基本检验指标的计算函数。
本文介绍如何使用这些函数,在 xarray 数组上计算要素场的基本检验指标。
介绍
等压面要素场的统计指标,包括:
- Mean Error
- Mean Absolute Error
- Standard Deviation
- RMSE
- RMSEm
- RMSEp
- ACC
本文以某次试验的 2018-08-01 12时次 24 时效的 1000hPa 温度场为例说明如何计算单个要素场的基本统计指标。
数据
重要提示:本文数据来自其他工具。
本文使用的数据均以 GRIB 1 格式保存,且已被插值到 1.5 度 * 1.5 度的经纬度网格。
本文将模式预报 000 时效的数据当成分析场。所以只涉及两类数据:
- 模式预报数据:文件名是
pgbfFFF.graeps.YYYYMMDDHH,其中FFF是预报时效,YYYYMMDDHH是起报时次 - 气候数据:文件名是
cmean_1d.1959MMDD
准备
导入需要的软件包
import numpy as np
import xarray as xr
import pandas as pd

import pathlib

from nwpc_data.grib.eccodes import (
    load_field_from_file
)
设置数据目录,使用模式本身的 000 时效作为分析场。
forecast_root_dir = "/some/path/to/ctrl1/"
analysis_root_dir = "/some/path/to/ctrl1/"
climate_root_dir = "/some/path/to/obdata/cmean"
设置通用参数
注意:本文仅使用区域参数 (regions, domains)
VAR = ["gh", "t", "u", "v", "wind"]
plevs = [1000, 850, 700, 500, 400, 300, 250, 100, 70, 50, 10]

regions = ["NHEM", "SHEM", "EASI", "TROP", "GLOB"]
domains = [
    [20, 90, 0, 360],
    [-90, -20, 0, 360],
    [15, 65, 70, 145],
    [-20, 20, 0, 360],
    [-90, 90, 0, 360],
]
设置当前分析场日期
current_date = pd.to_datetime("2018-08-01 12:00")
当前预报小时数
current_forecast_hour = 24
数据文件路径
对于所有的预报时效,分析场和气候场的文件路径是相同的。
分析场路径
analysis_file_path = pathlib.Path(
    analysis_root_dir,
    f"pgbf000.grapes.{current_date.strftime('%Y%m%d%H')}",
)
analysis_file_path
PosixPath('/some/path/to/ctrl1/pgbf000.grapes.2018080112')
气候场路径
climate_data_path = pathlib.Path(
    climate_root_dir,
    f"cmean_1d.1959{current_date.strftime('%m%d')}",
)
climate_data_path
PosixPath('/some/path/to/obdata/cmean/cmean_1d.19590801')
预报场文件路径与预报小时 (current_forecast_hour) 变量有关
# 计算起报时间
forecast_date = current_date - pd.Timedelta(hours=current_forecast_hour)

forecast_data_path = pathlib.Path(
    forecast_root_dir,
    f"pgbf{current_forecast_hour:03d}.grapes.{forecast_date.strftime('%Y%m%d%H')}"
)
forecast_data_path
PosixPath('/some/path/to/ctrl1/pgbf024.grapes.2018073112')
加载数据
以 1000hPa 温度场为例,使用 nwpc-data 库的 nwpc_data.grib.eccodes.load_field_from_file 函数加载要素场。
plev = 1000
variable_name = "t"
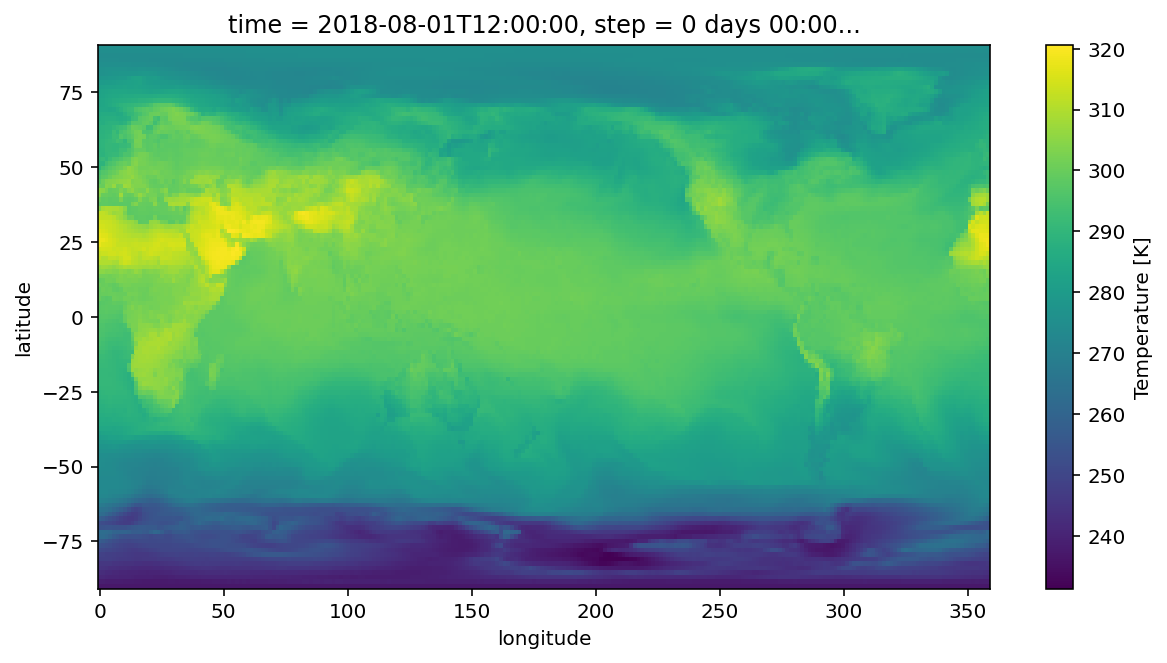
预报场
forecast_field = load_field_from_file(
file_path=forecast_data_path,
parameter=variable_name,
level_type="isobaricInhPa",
level=plev
)
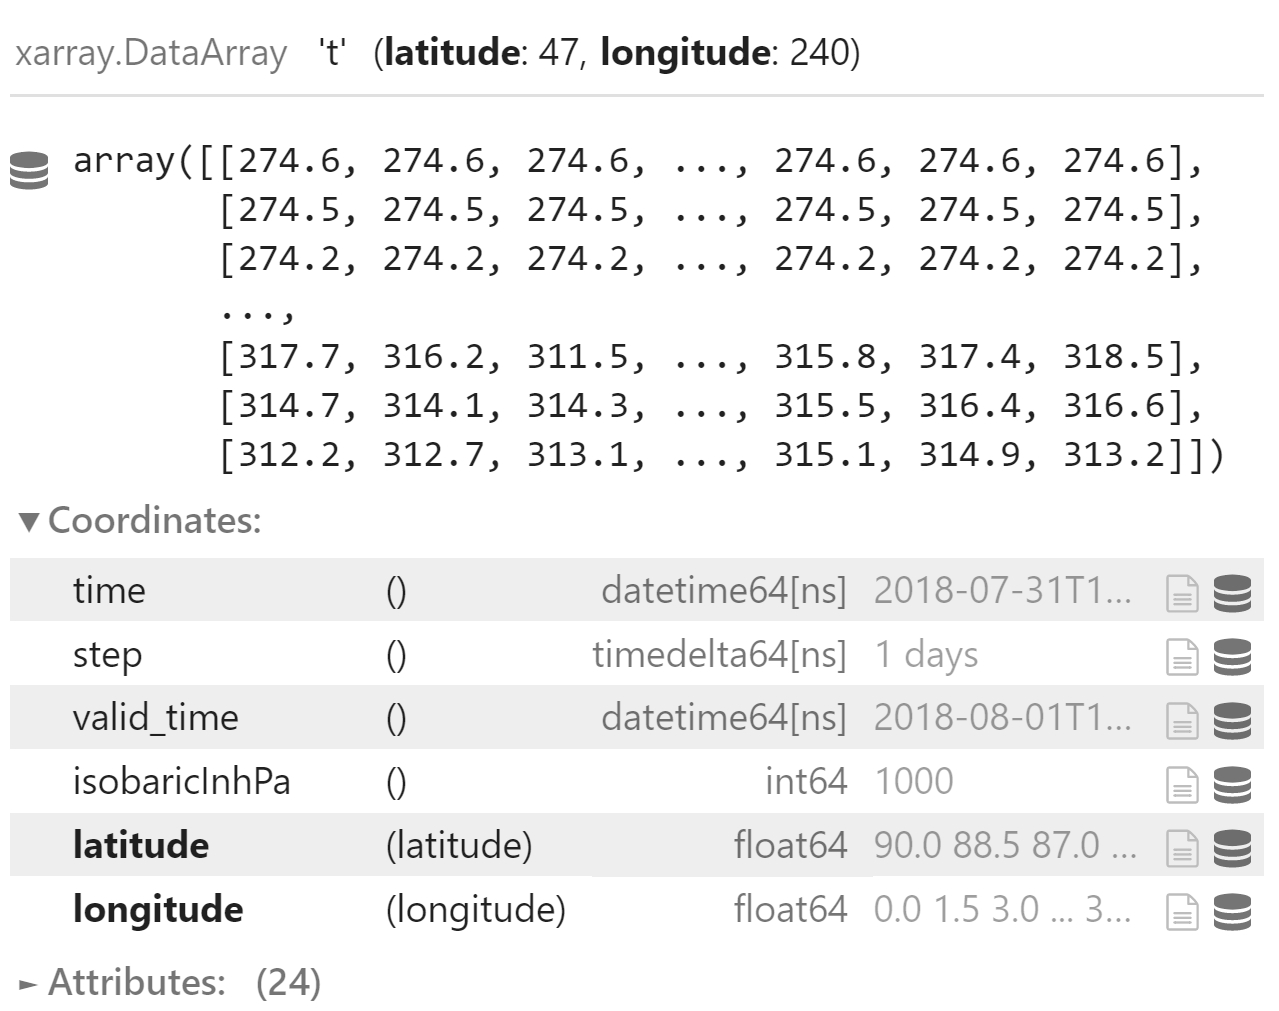
forecast_field
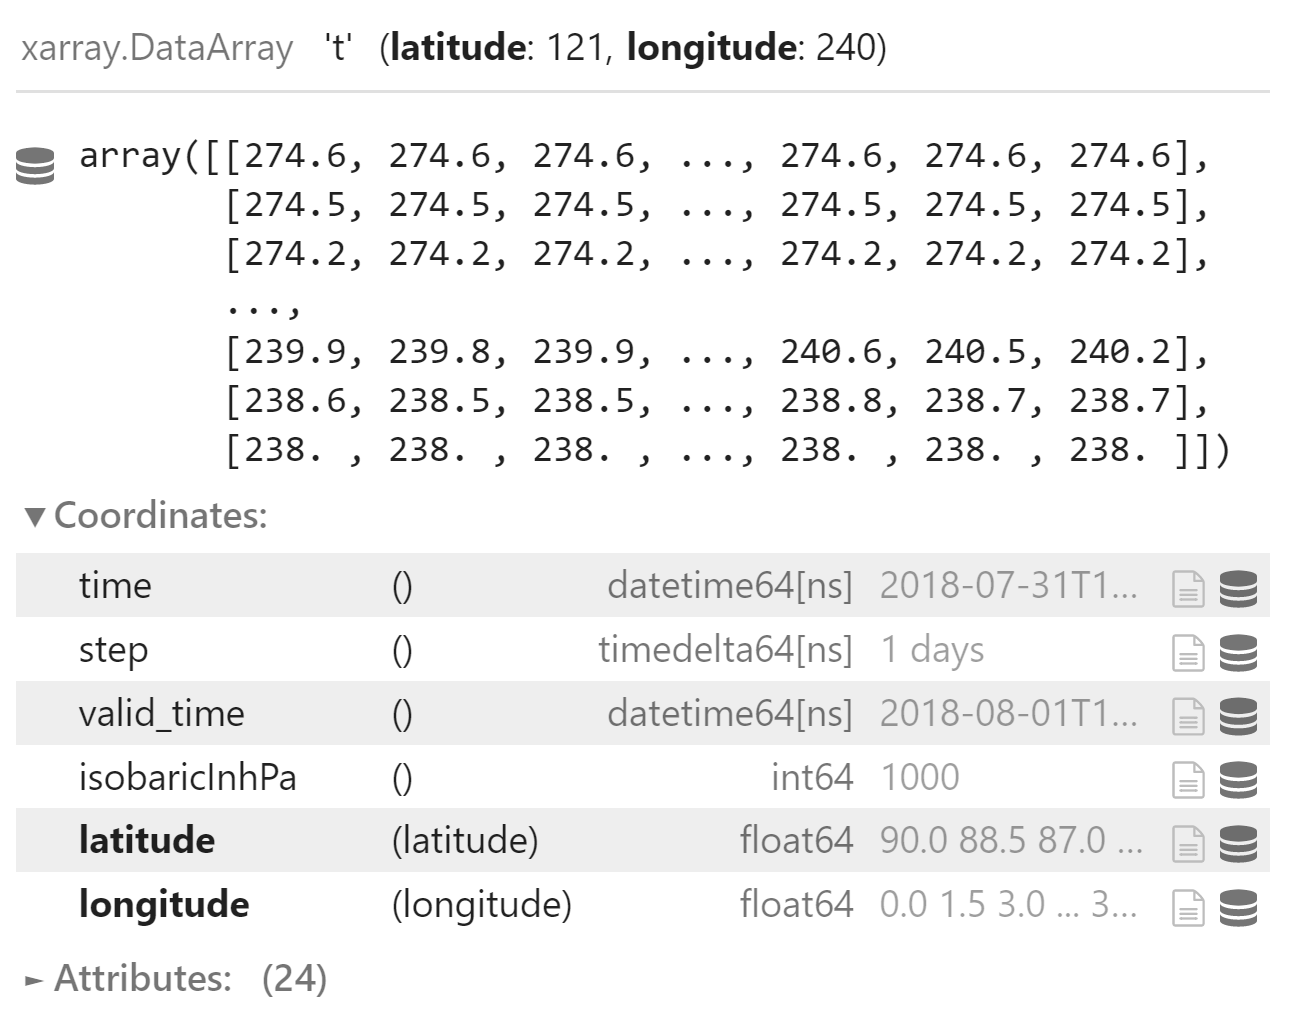
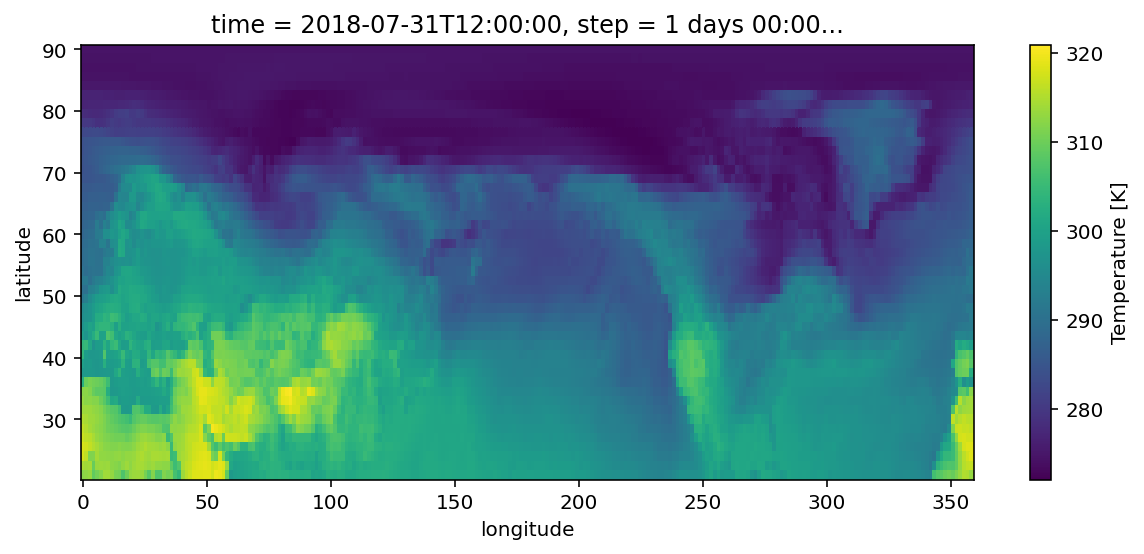
forecast_field.plot(figsize=(10, 5))
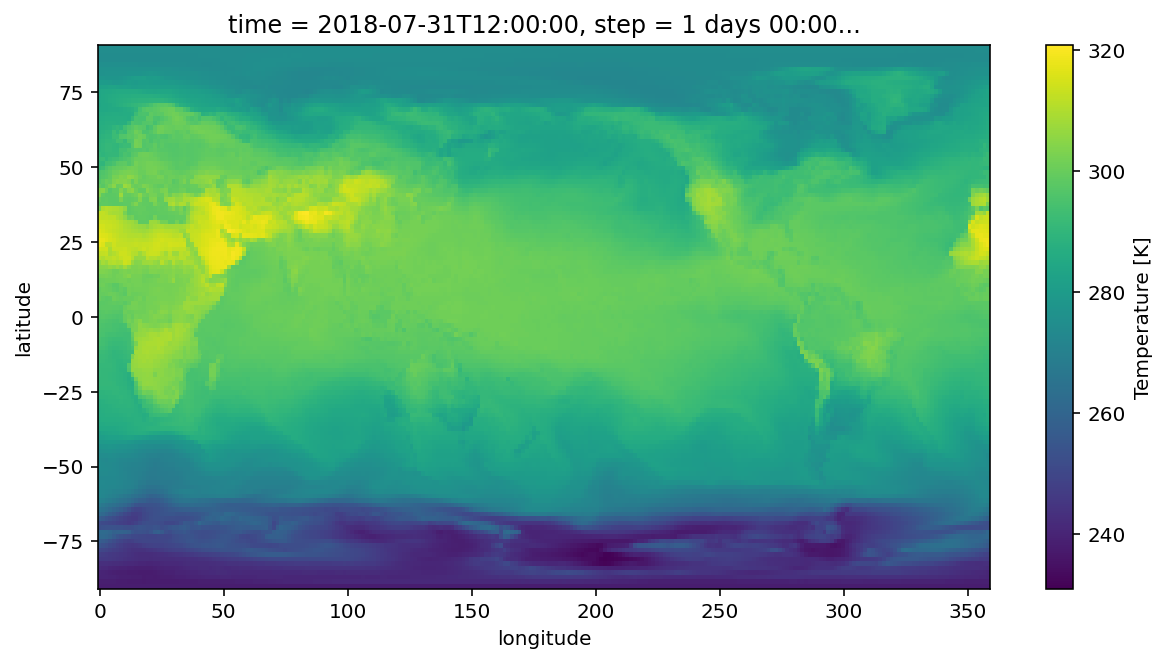
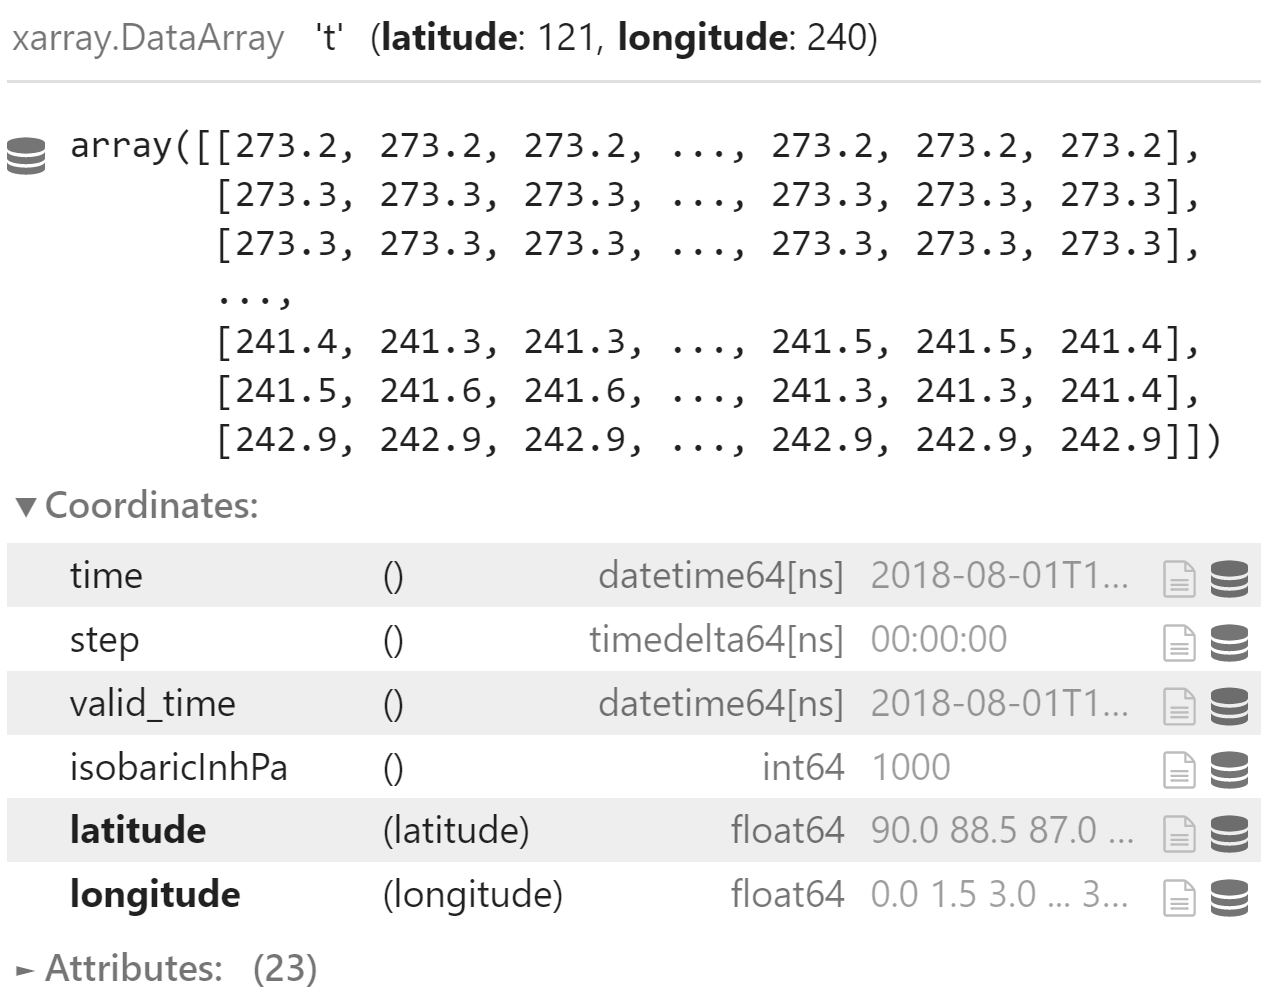
分析场
analysis_field = load_field_from_file(
    file_path=analysis_file_path,
    parameter=variable_name,
    level_type="isobaricInhPa",
    level=plev,
)
analysis_field
analysis_field.plot(figsize=(10, 5))
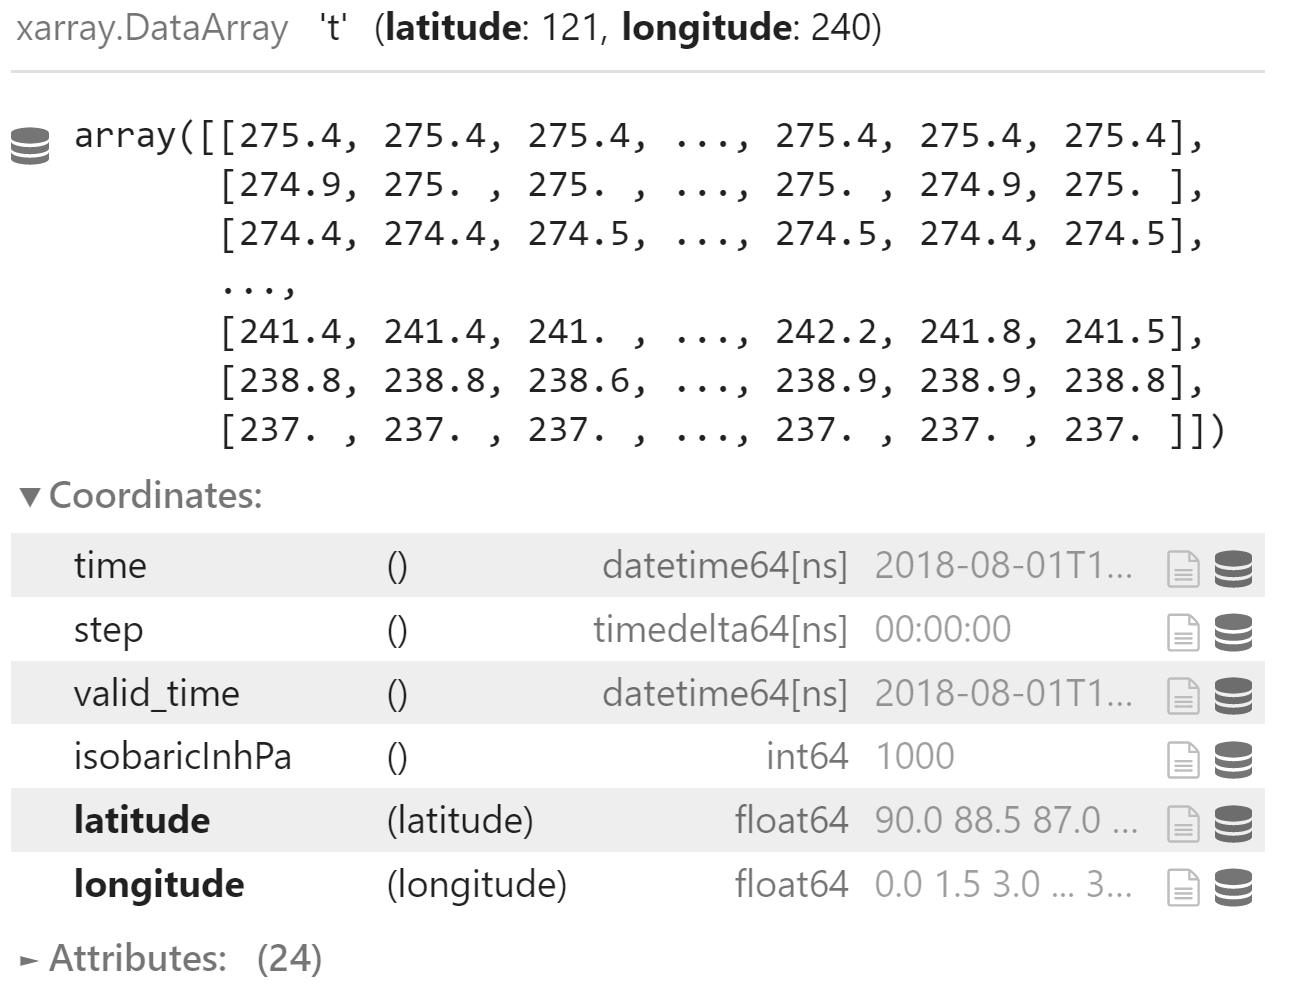
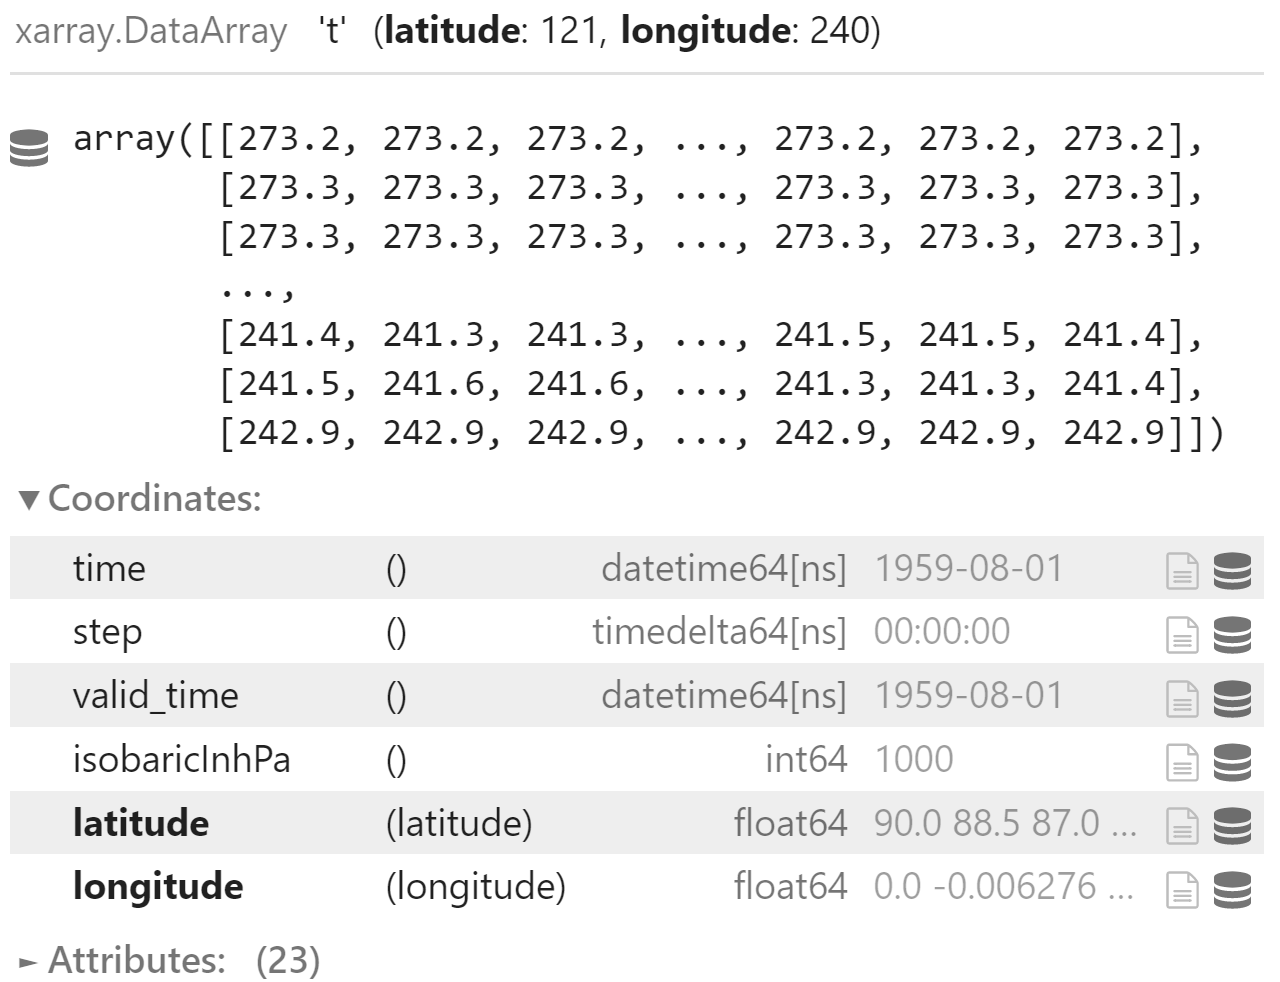
气候场
climate_field = load_field_from_file(
    file_path=climate_data_path,
    parameter=variable_name,
    level_type="isobaricInhPa",
    level=plev,
)
climate_field
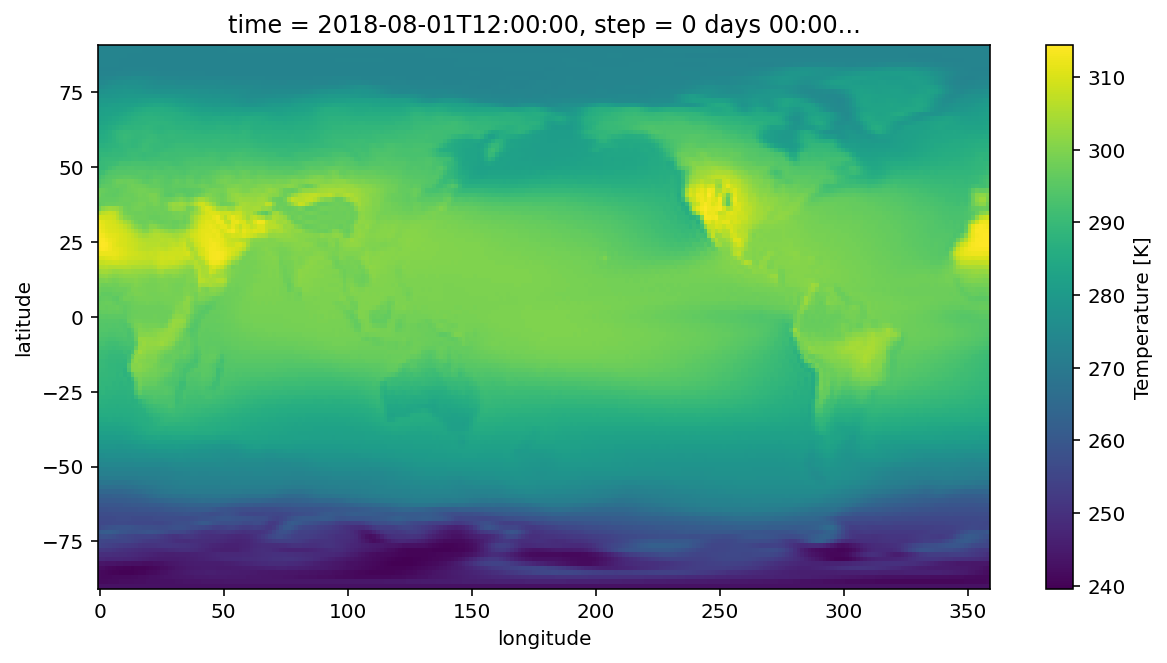
目前 nwpc-data 库无法正确识别气候场数据的经度信息,所以需要手动设置 logitude 维度坐标。
climate_field["longitude"] =  analysis_field.longitude
climate_field
climate_field.plot(figsize=(10, 5))
处理数据
提取北半球数据
北半球的区域范围
region = regions[0]
domain = domains[0]
domain
[20, 90, 0, 360]
使用 sel 方法选择子区域数据
domain_forecast_field = forecast_field.sel(
    latitude=slice(*domain[1::-1]),
    longitude=slice(*domain[2:]),
)
domain_forecast_field
domain_forecast_field.plot(figsize=(10, 4))
获取分析场和气候场的子区域数据
domain_analysis_field = analysis_field.sel(
    latitude=slice(90, 20),
    longitude=slice(0, 360),
)
domain_climate_field = climate_field.sel(
    latitude=slice(90, 20),
    longitude=slice(0, 360),
)
子区域的纬度数据 (latitudes),用于计算指标
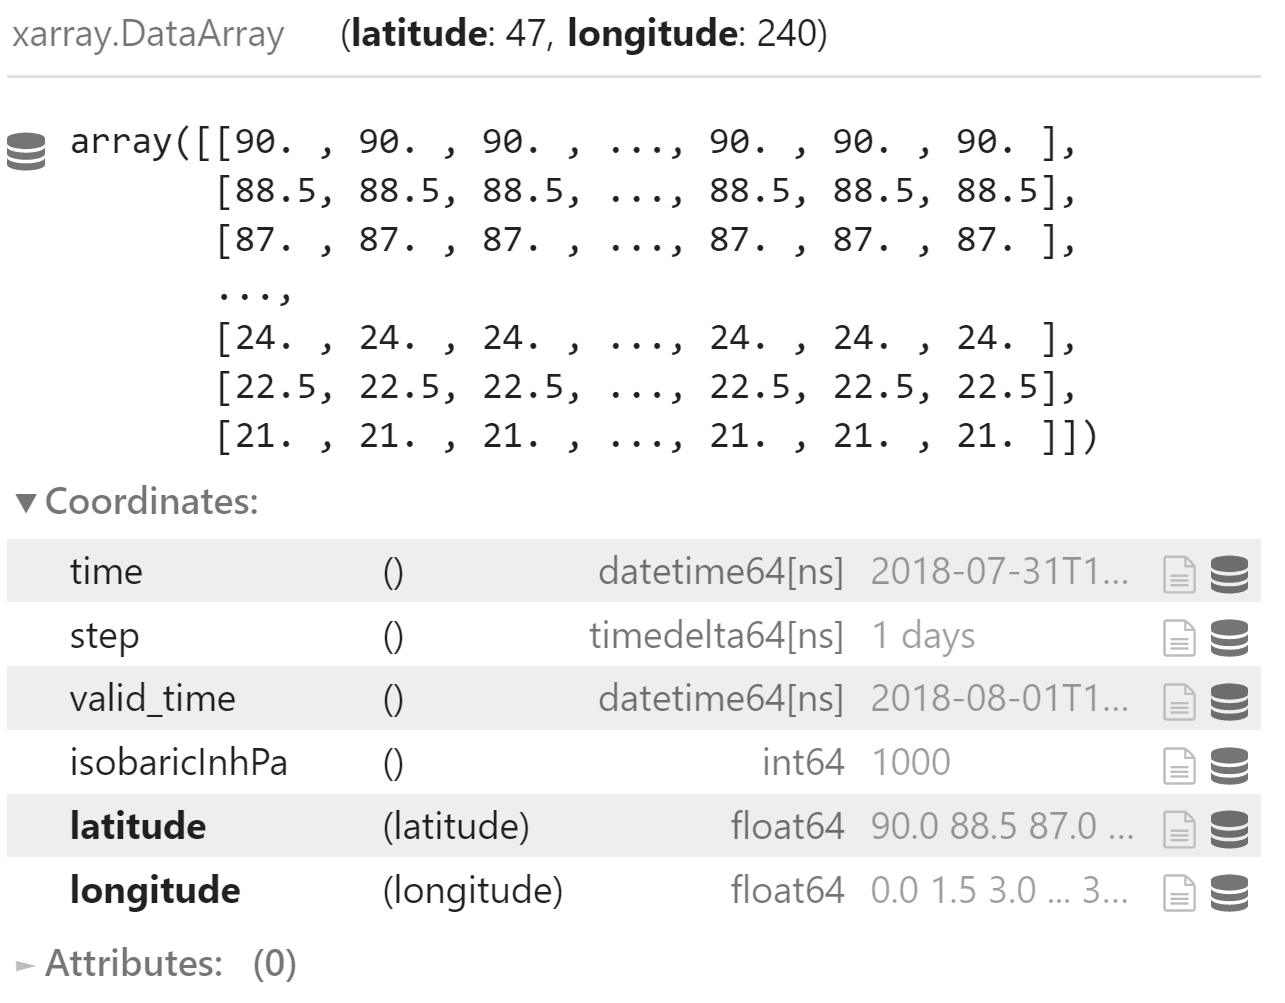
latitudes = domain_forecast_field.latitude * xr.ones_like(domain_forecast_field)
latitudes
计算指标
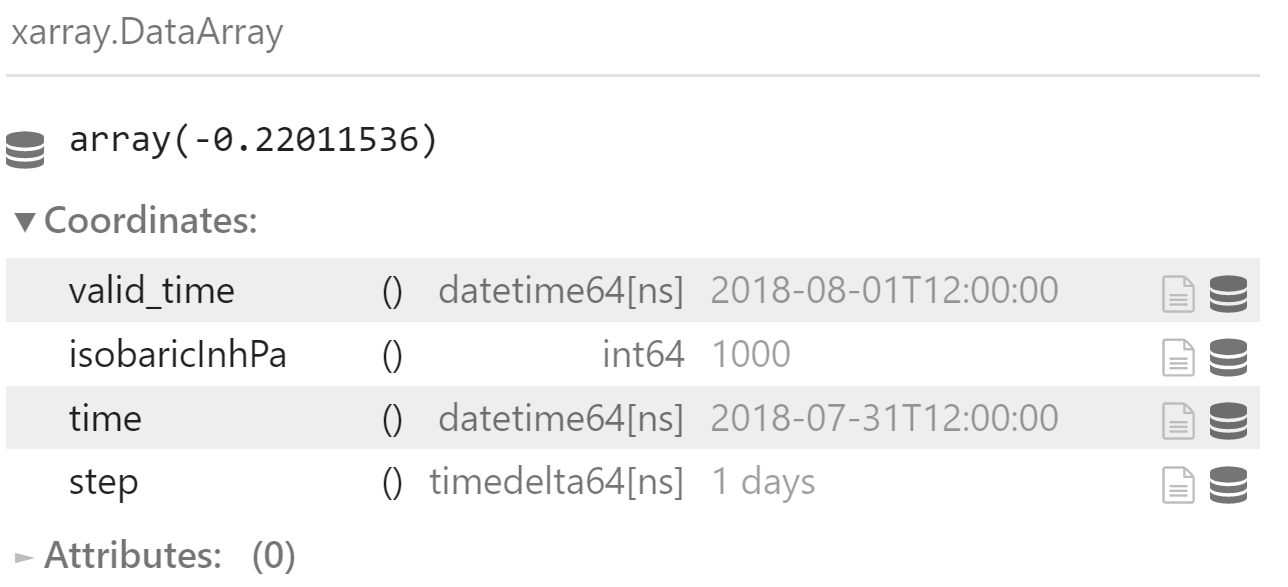
Mean Error
bias = np.sum(
    (domain_forecast_field - domain_analysis_field) * np.cos(latitudes * np.pi / 180.)
) / np.sum(np.cos(latitudes * np.pi / 180.))
bias
Mean Absolute Error
absolute_bias = np.sum(
    np.abs(domain_forecast_field - domain_analysis_field) * np.cos(latitudes * np.pi / 180.0)
) / np.sum(np.cos(latitudes * np.pi / 180.0))
absolute_bias
Standard Deviation
std = np.sqrt(
    np.sum(
        np.power(domain_forecast_field - domain_analysis_field - bias, 2) * np.cos(latitudes * np.pi / 180.)
    ) / np.sum(np.cos(latitudes * np.pi / 180.))
)
std
RMSE
mse = np.sum(
    np.power(domain_forecast_field - domain_analysis_field, 2) * np.cos(latitudes * np.pi / 180.0)
) / np.sum(
    np.cos(latitudes * np.pi / 180.0)
)
mse
rmse = np.sqrt(mse)
rmse
RMSEm
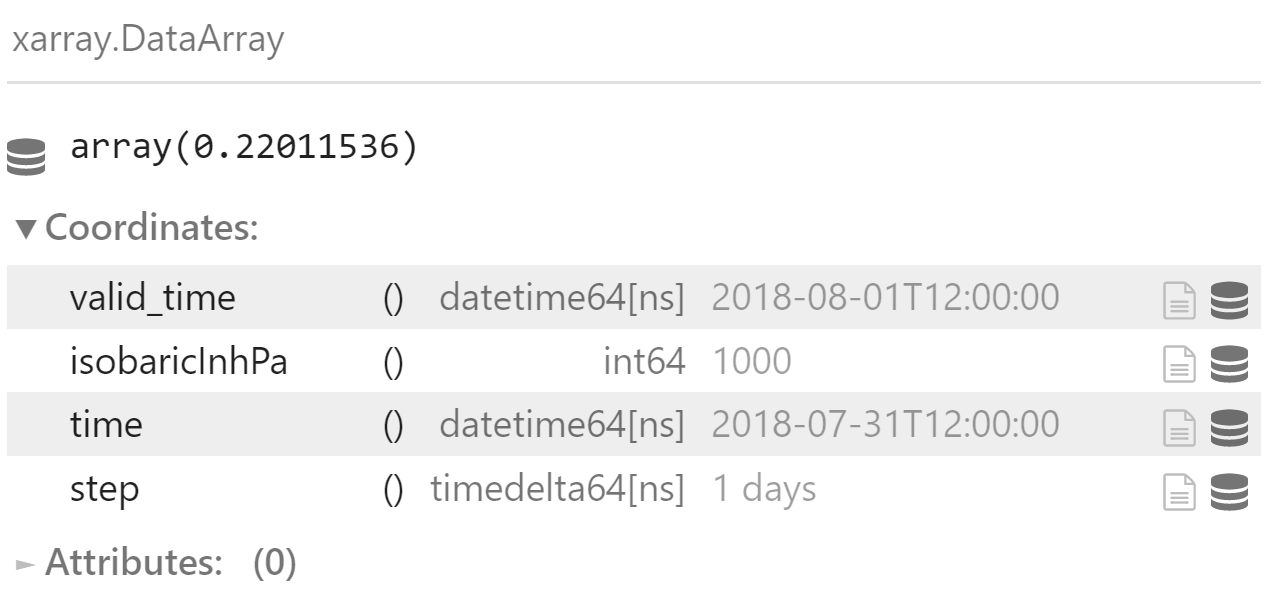
rmsem = np.abs(bias)
rmsem
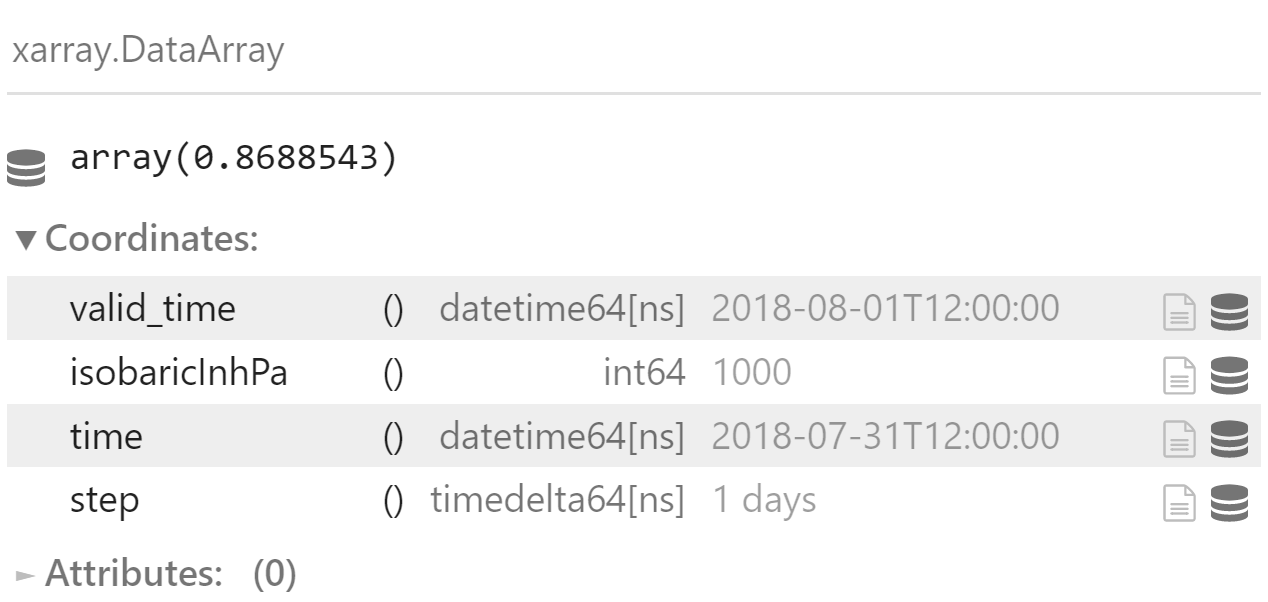
RMSEp
rmsep = rmse - rmsem
rmsep
ACC
forecast_climate = np.sum(
    (domain_forecast_field - domain_climate_field) * np.cos(latitudes * np.pi / 180.)
) / np.sum(np.cos(latitudes * np.pi / 180.))

obs_climate = np.sum(
    (domain_analysis_field - domain_climate_field) * np.cos(latitudes * np.pi / 180.)
) / np.sum(np.cos(latitudes * np.pi / 180.))

acc1 = np.sum(
    (
        domain_forecast_field - domain_climate_field - forecast_climate
    ) * (
        domain_analysis_field - domain_climate_field - obs_climate
    ) * np.cos(latitudes * np.pi / 180.)
)

acc2 = np.sum(
    np.power(
        domain_forecast_field - domain_climate_field - forecast_climate, 2
    ) * np.cos(latitudes * np.pi / 180.)
)

acc3 = np.sum(
    np.power(
        domain_analysis_field - domain_climate_field - obs_climate, 2
    ) * np.cos(latitudes * np.pi / 180.)
)

acc = acc1 / np.sqrt(acc2 * acc3)
acc