预测雷暴旋转的基础机器学习:分类 - 系数与正则化
本文翻译自 AMS 机器学习 Python 教程,并有部分修改。
Lagerquist, R., and D.J. Gagne II, 2019: “Basic machine learning for predicting thunderstorm rotation: Python tutorial”. https://github.com/djgagne/ams-ml-python-course/blob/master/module_2/ML_Short_Course_Module_2_Basic.ipynb.
本文接上一篇文章。
系数
下一个单元为逻辑回归模型绘制系数。
正(负)系数意味着概率随着预测变量的增加(减小)。
同样,将预测变量归一化为相同的标度 (z-scores),因此通常具有较大系数的预测变量更为重要。
plot_model_coefficients 函数绘制模型系数
def plot_model_coefficients(
    model,
    predictor_names
):

    coefficients = model.coef_
    num_dimensions = len(coefficients.shape)
    if num_dimensions > 1:
        coefficients = coefficients[0, ...]

    num_predictors = len(predictor_names)
    y_coords = np.linspace(
        0, num_predictors - 1,
        num=num_predictors,
        dtype=float
    )

    _, axes_object = pyplot.subplots(
        1, 1,
        figsize=(10, 10)
    )

    axes_object.barh(
        y_coords, coefficients,
        color=np.array([27, 158, 119], dtype=float) / 255,
        edgecolor=np.array([27, 158, 119], dtype=float) / 255,
        linewidth=2
    )

    pyplot.xlabel('Coefficient')
    pyplot.ylabel('Predictor variable')

    pyplot.yticks([], [])
    x_tick_values, _ = pyplot.xticks()
    pyplot.xticks(x_tick_values, rotation=90)

    x_min = np.percentile(coefficients, 1.)
    x_max = np.percentile(coefficients, 99.)
    pyplot.xlim([x_min, x_max])

    for j in range(num_predictors):
        axes_object.text(
            0, y_coords[j], predictor_names[j],
            color=np.array([217, 95, 2], dtype=float) / 255,
            horizontalalignment='center',
            verticalalignment='center',
            fontsize=14
        )
绘制逻辑回归模型的系数
plot_model_coefficients(
    model=plain_log_model,
    predictor_names=list(training_predictor_table)
)

pyplot.show()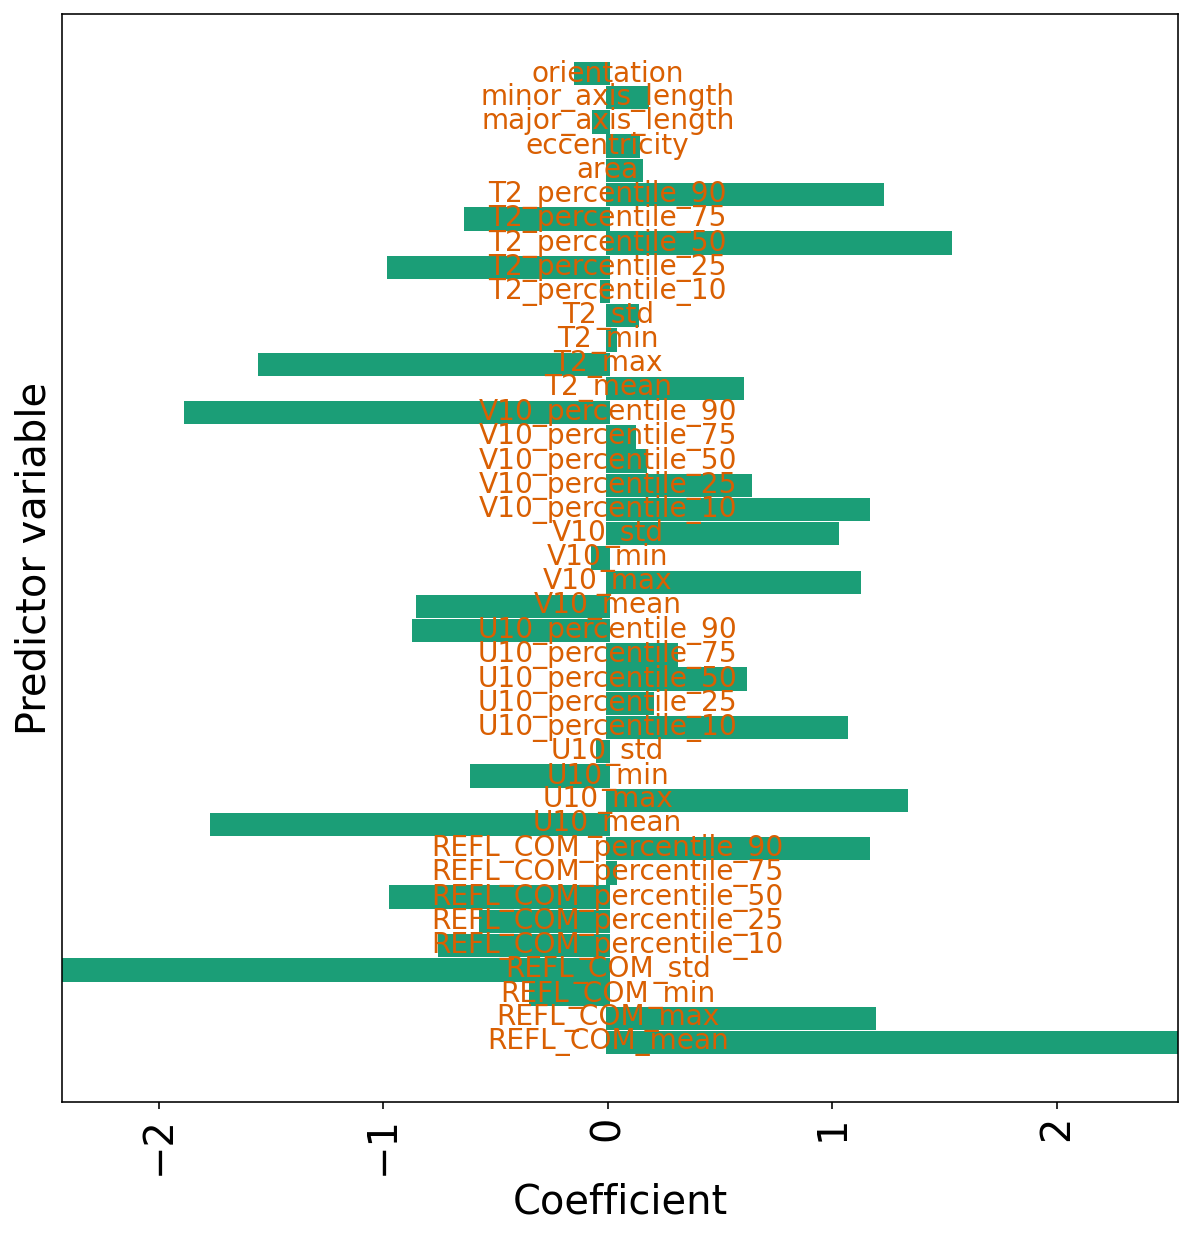
带 L1 和 L2 惩罚项的逻辑回归
下一个单元训练同时具有 L1 和 L2 正则化的逻辑回归模型。
对于线性回归,您可以进行超参数实验以找到逻辑回归的最佳 lambda1 和 lambda2。
现在您可以了解为什么仅说“lasso regression”或“ridge regression”或“elastic-net regression”并不能说明问题。 这种类型的正则化可以应用于不同的基础模型。
创建模型
logistic_en_model = setup_logistic_regression(
    lambda1=1e-3,
    lambda2=1e-3
)
logistic_en_model
SGDClassifier(alpha=0.002, l1_ratio=0.5, loss='log', penalty='elasticnet',
random_state=6695)
训练模型
_ = train_logistic_regression(
    model=logistic_en_model,
    training_predictor_table=training_predictor_table,
    training_target_table=training_target_table
)
在验证集上的性能
validation_probabilities = logistic_en_model.predict_proba(
    validation_predictor_table.values
)[:, 1]
training_event_frequency = np.mean(
    training_target_table[BINARIZED_TARGET_NAME].values
)

eval_binary_classifn(
    observed_labels=validation_target_table[BINARIZED_TARGET_NAME].values,
    forecast_probabilities=validation_probabilities,
    training_event_frequency=training_event_frequency,
    dataset_name="validation",
)
Validation Max Peirce score (POD - POFD) = 0.662
Validation AUC (area under ROC curve) = 0.907
Validation Max CSI (critical success index) = 0.396
Validation Brier score = 0.062
Validation Brier skill score (improvement over climatology) = 0.318
<matplotlib.colorbar.Colorbar object at 0x00000227F5DC0F48>
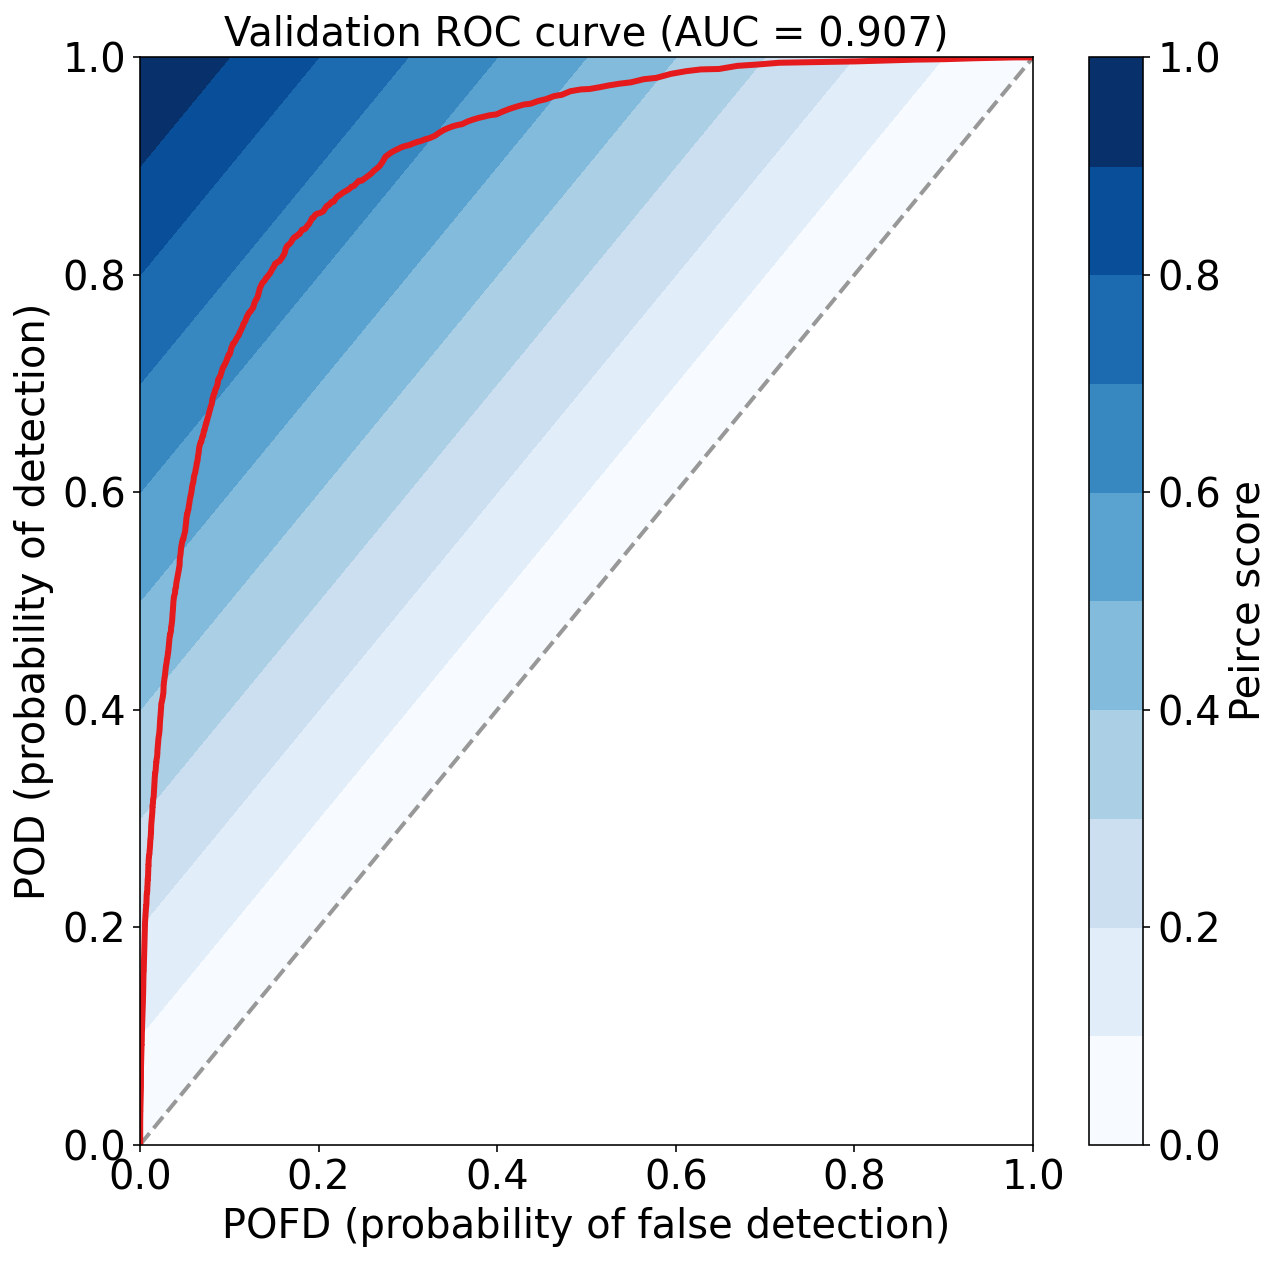
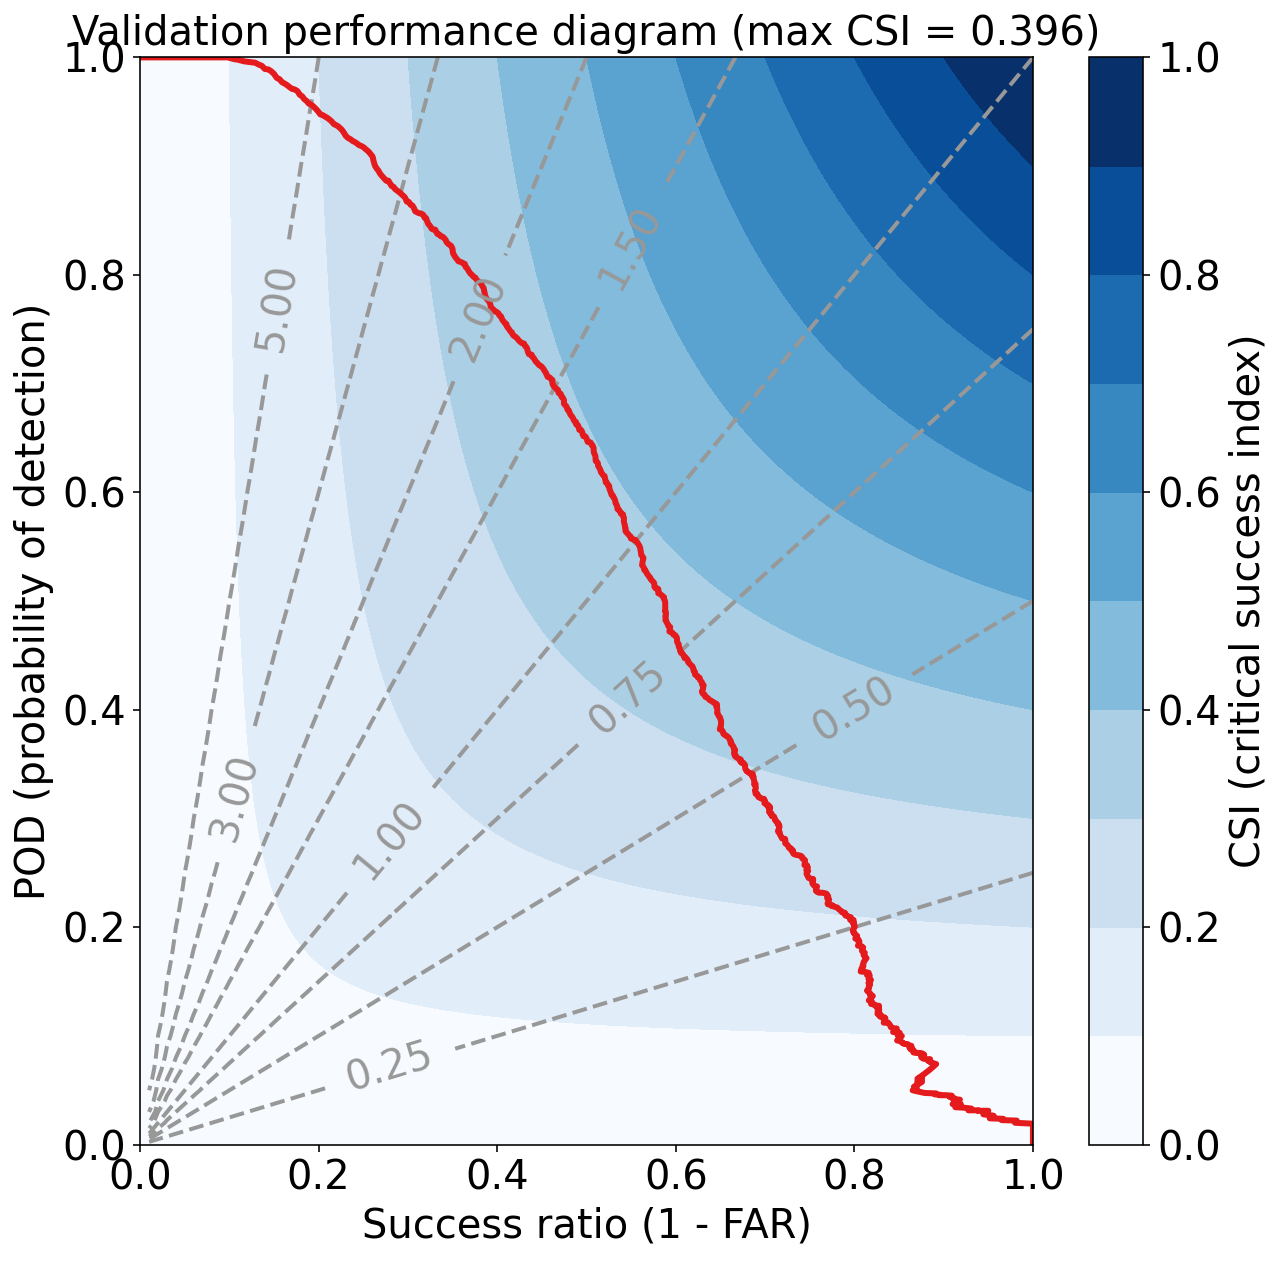
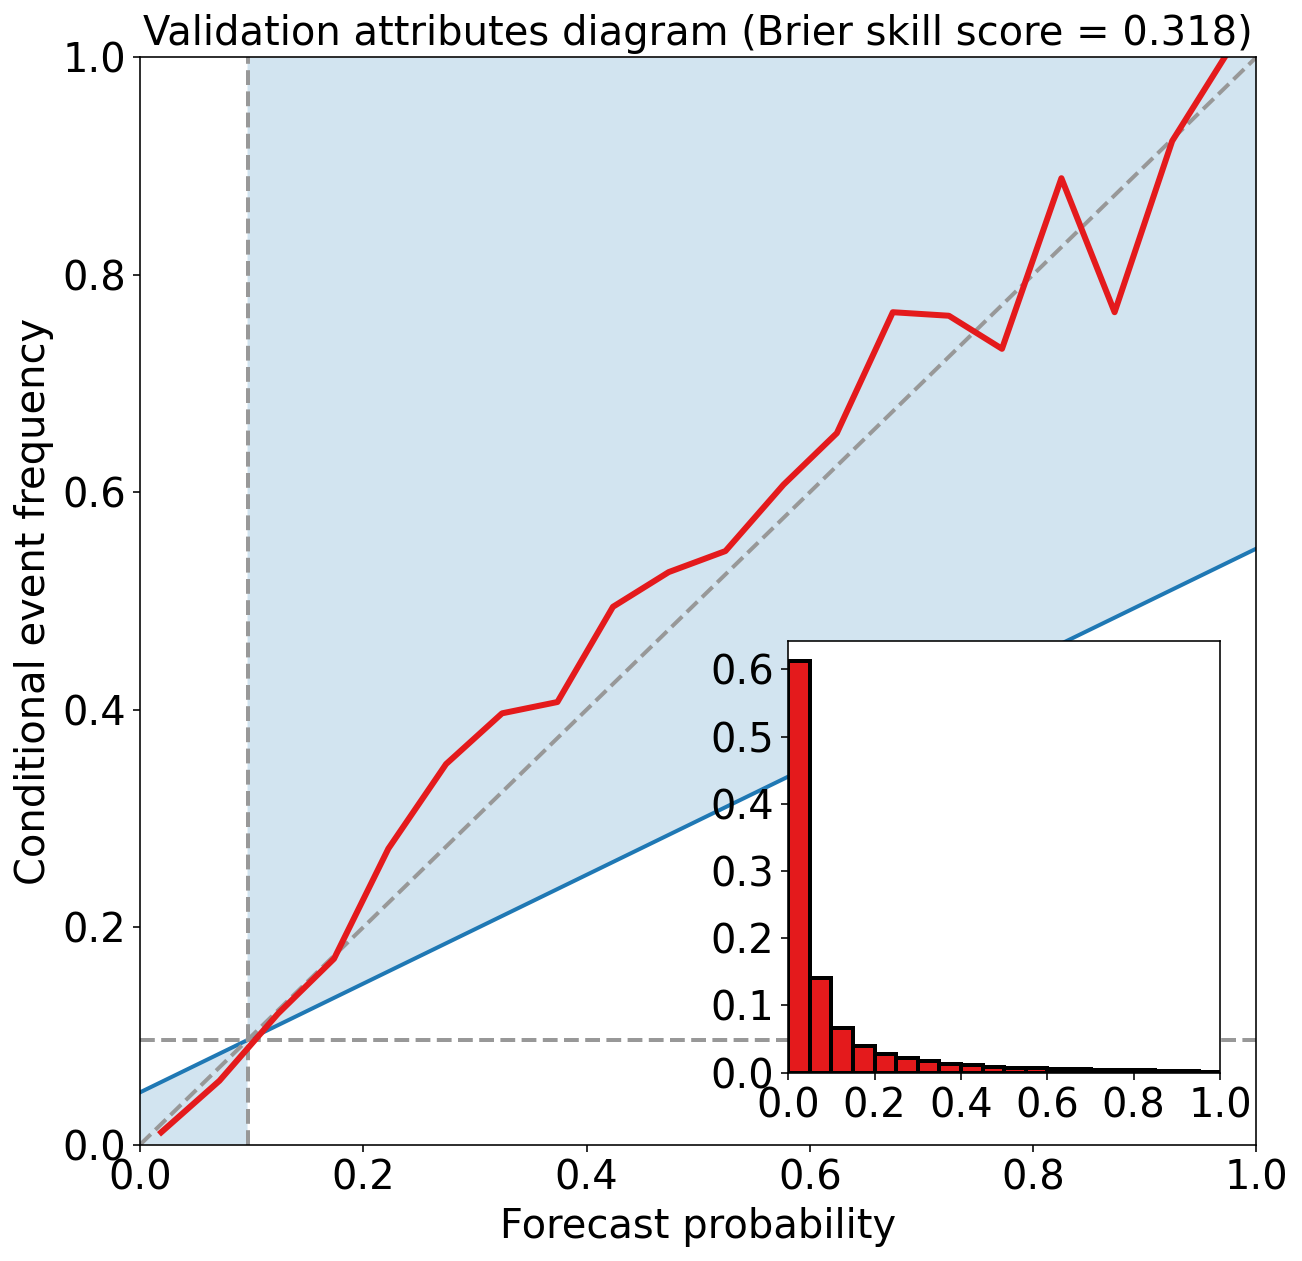
系数
下一个单元格绘制了具有两种惩罚项的逻辑回归模型的系数。
许多系数为零,非零系数大约比原始模型小一个数量级。
plot_model_coefficients(
    model=logistic_en_model,
    predictor_names=list(training_predictor_table)
)
pyplot.show()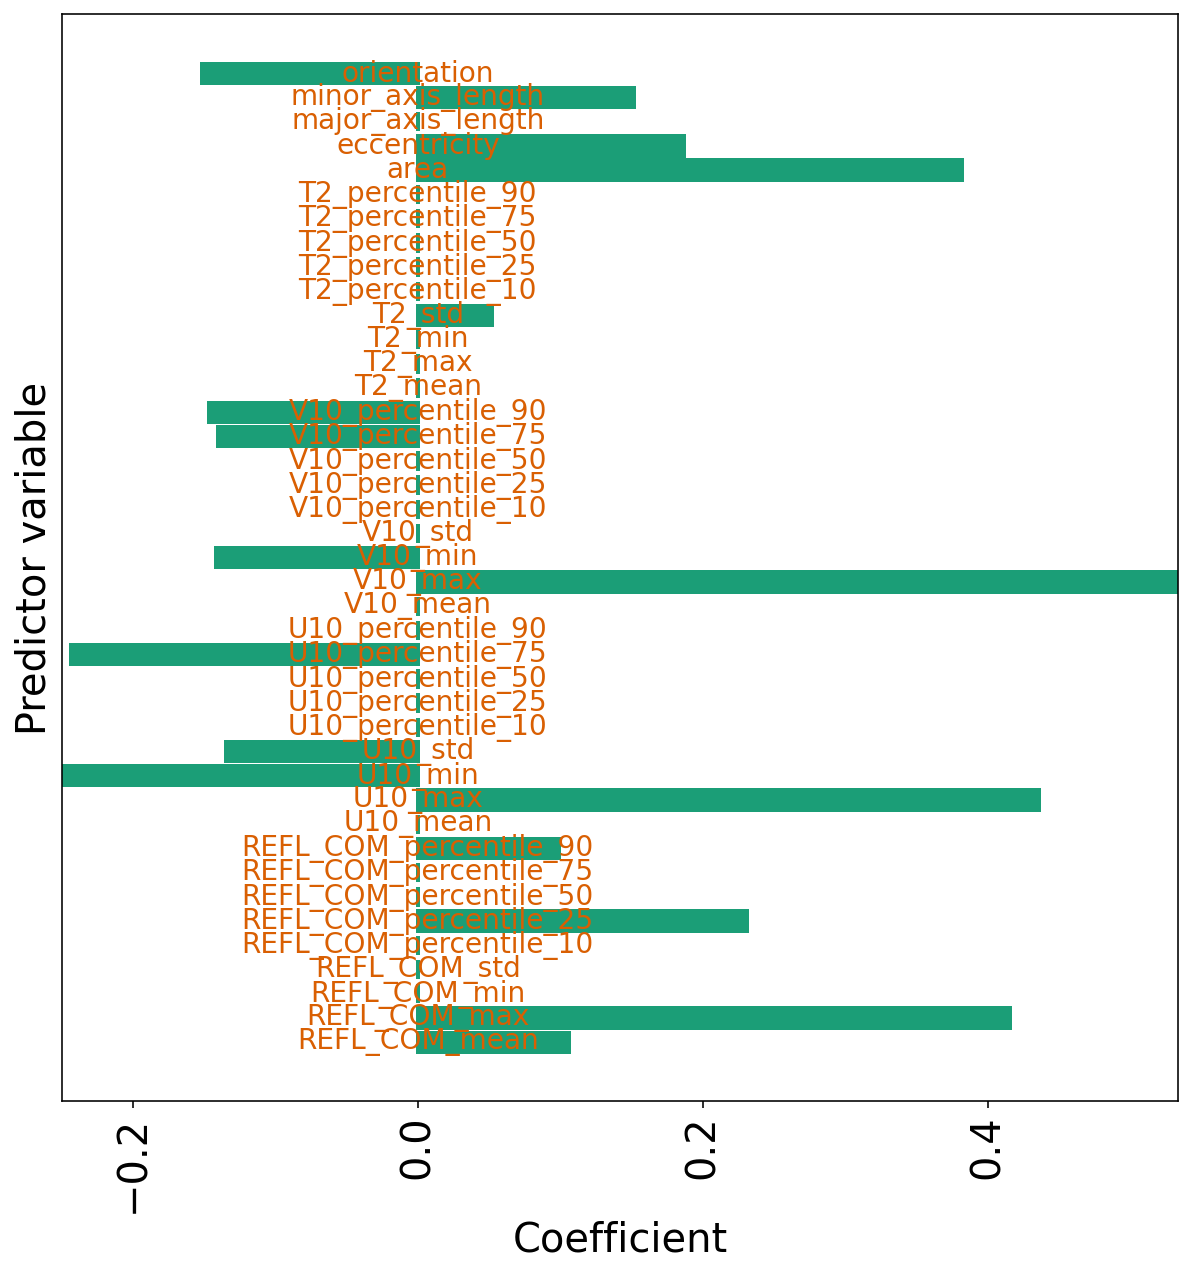
练习
用您自己的 lambda1 和 lambda2 值训练逻辑回归模型。 探究在训练和验证数据上的性能,并绘制系数。
本文是AMS机器学习课程中预测雷暴旋转的基础机器学习章节介绍逻辑回归的最后一篇文章。
参考
https://github.com/djgagne/ams-ml-python-course
AMS 机器学习课程
数据预处理:
《数据分析与预处理》
实际数据处理:
线性回归:
逻辑回归:
