使用 Jupyter Widgets 构建简单的交互应用
在之前的文章《使用Jupyter Notebook显示NCL绘图》中介绍如何将 NWPC 业务系统的 NCL 绘图脚本集成到 Jupyter Notebook 中。
使用 show_plot 函数在 Notebook 中显示图片。
from nwpc_graphics.systems.grapes_gfs_gmf import show_plot

show_plot("pwat_sfc_an_aea", "2020011300", "24h")
函数调用的方式不够方便,本文介绍使用 Jupyter Wdigets 即 ipywidgets 包封装上述的函数调用,构建简单的交互应用。
控件
ipywidgets 包为开发人员提供使用 Python 代码生成 Web 控件的功能,提供大量常用的 Web 交互部件。
基本用法请参考官方文档《Simple Widget Introduction》,不再介绍。
针对本文封装函数调用的目标,我们需要从控件中获取参数值。
下拉菜单
图片类型使用下拉菜单。
让我们首先创建一个下拉菜单 Dropdown,使用 plotters 的 key 列表作为值选项。
直接创建的控件不会显示在输出结果中,需要调用 ipython 的 display 函数
plot_type_options = widgets.Dropdown(
    options=list(plotters.keys()),
    value=list(plotters.keys())[0],
    description="Plot Type:",
    disabled=False,
)
display(plot_type_options)

使用控件的 .value 属性获取用户选择的值
plot_type_options.value
hgt_p500_mslp_sfc_fc_aeua
另外起报时次(00,06,12,18)也使用下拉菜单,不再介绍。
日期
起报日期使用日期控件。
yesterday = datetime.datetime.now() - datetime.timedelta(days=1)
start_date_option = widgets.DatePicker(
    description='Start Date:',
    value=yesterday,
    disabled=False
)
display(start_date_option)
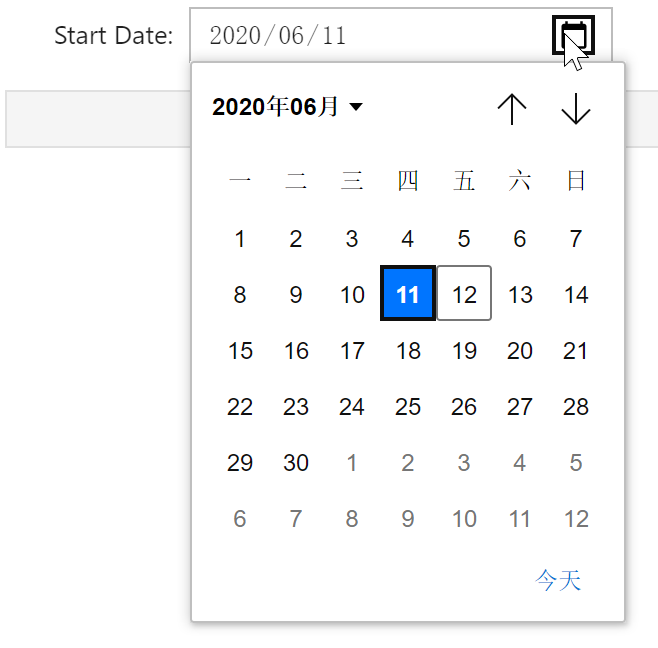
日期控件的值是 datetime.datetime 类型
start_date_option.value
datetime.datetime(2020, 6, 11, 9, 50, 48, 356458)
文本框
预报时效使用文本框。
forecast_time_option = widgets.Text(
    value="24h",
    description="Forecast Time:",
    disabled=False,
)
display(forecast_time_option)

文本框控件的值是字符串
forecast_time_option.value
'24h'
按钮
还需要为用户提供执行函数的方式,可以通过按钮控件来实现。
Button 最重要的功能在于可以执行回调函数。
直接在 Button 的 callback 函数中执行 show_plot 函数,会在单独的 Log 控制台显示图片,而不是显示在当前的 Notebook 中。
如下图所示:
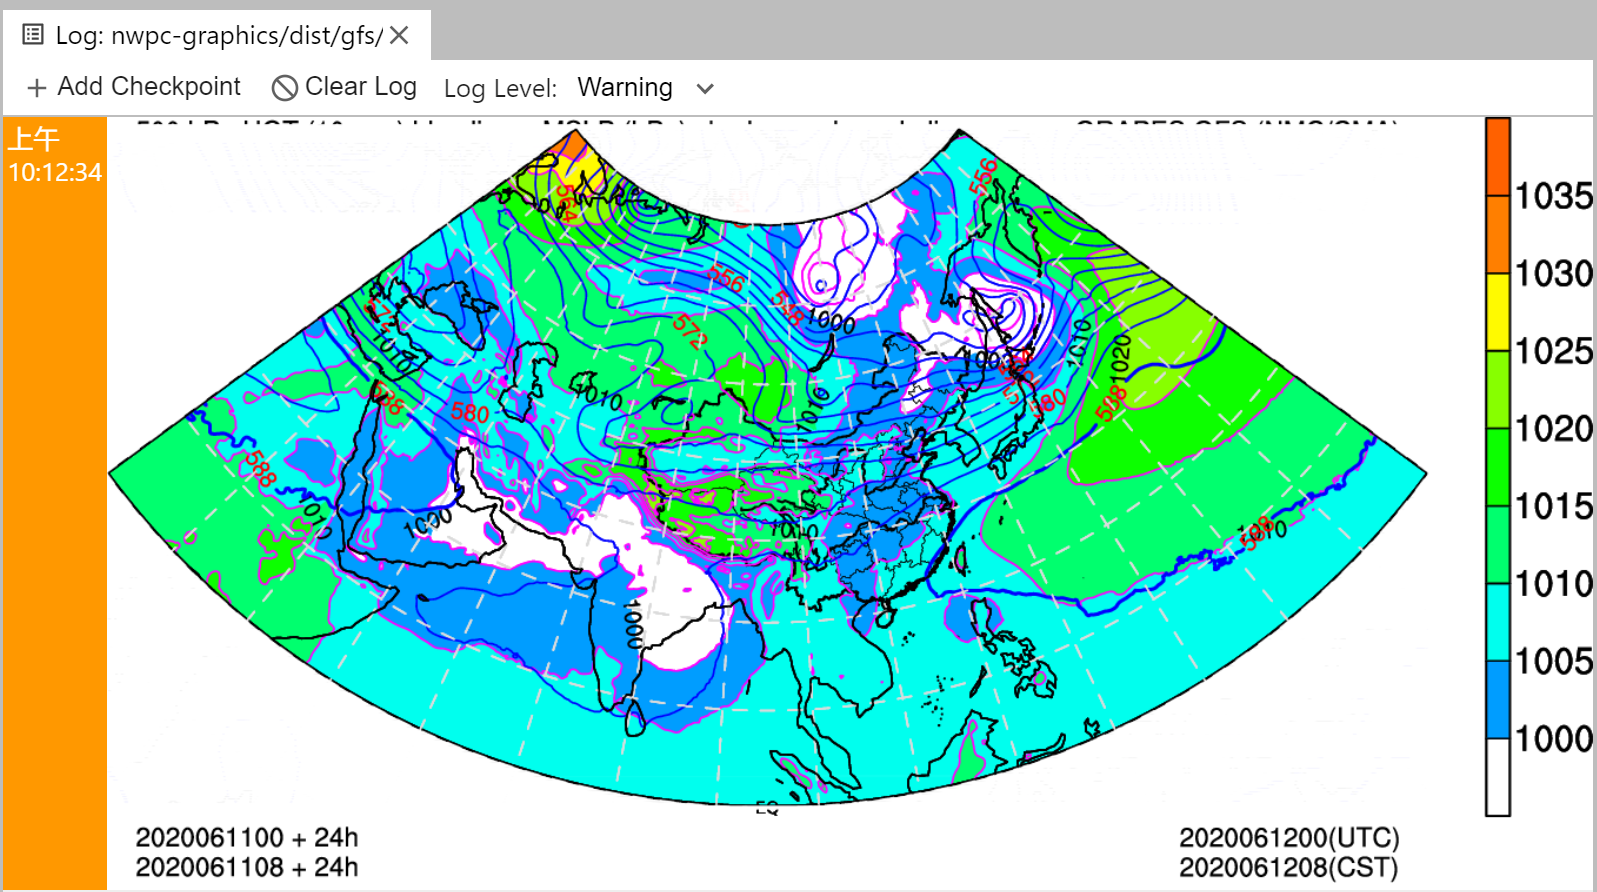
Jupyter Wdigets 提供 output 控件,借用 Jupyer 的显示系统。
out = widgets.Output()

button = widgets.Button(
    description='Plot',
    disabled=False,
    button_style='',
    tooltip='Plot the image',
    icon='',
)

@out.capture()
def plot(event):
    out.clear_output()
    start_date = start_date_option.value

    system_module.show_plot(
        plot_type_options.value,
        start_time=f'{start_date.strftime("%Y%m%d")}{start_hour_option.value}',
        forecast_time=forecast_time_option.value,
    )

button.on_click(plot)
display(button)
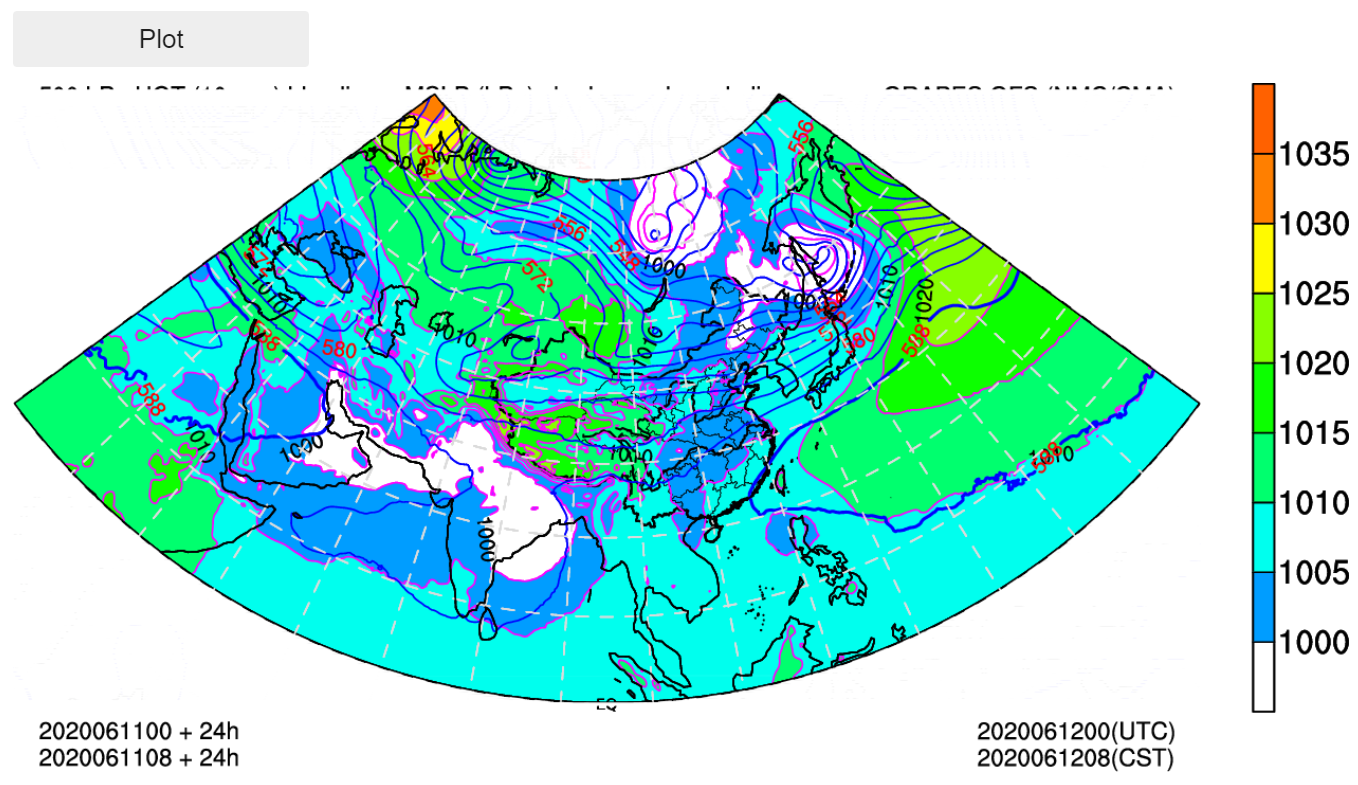
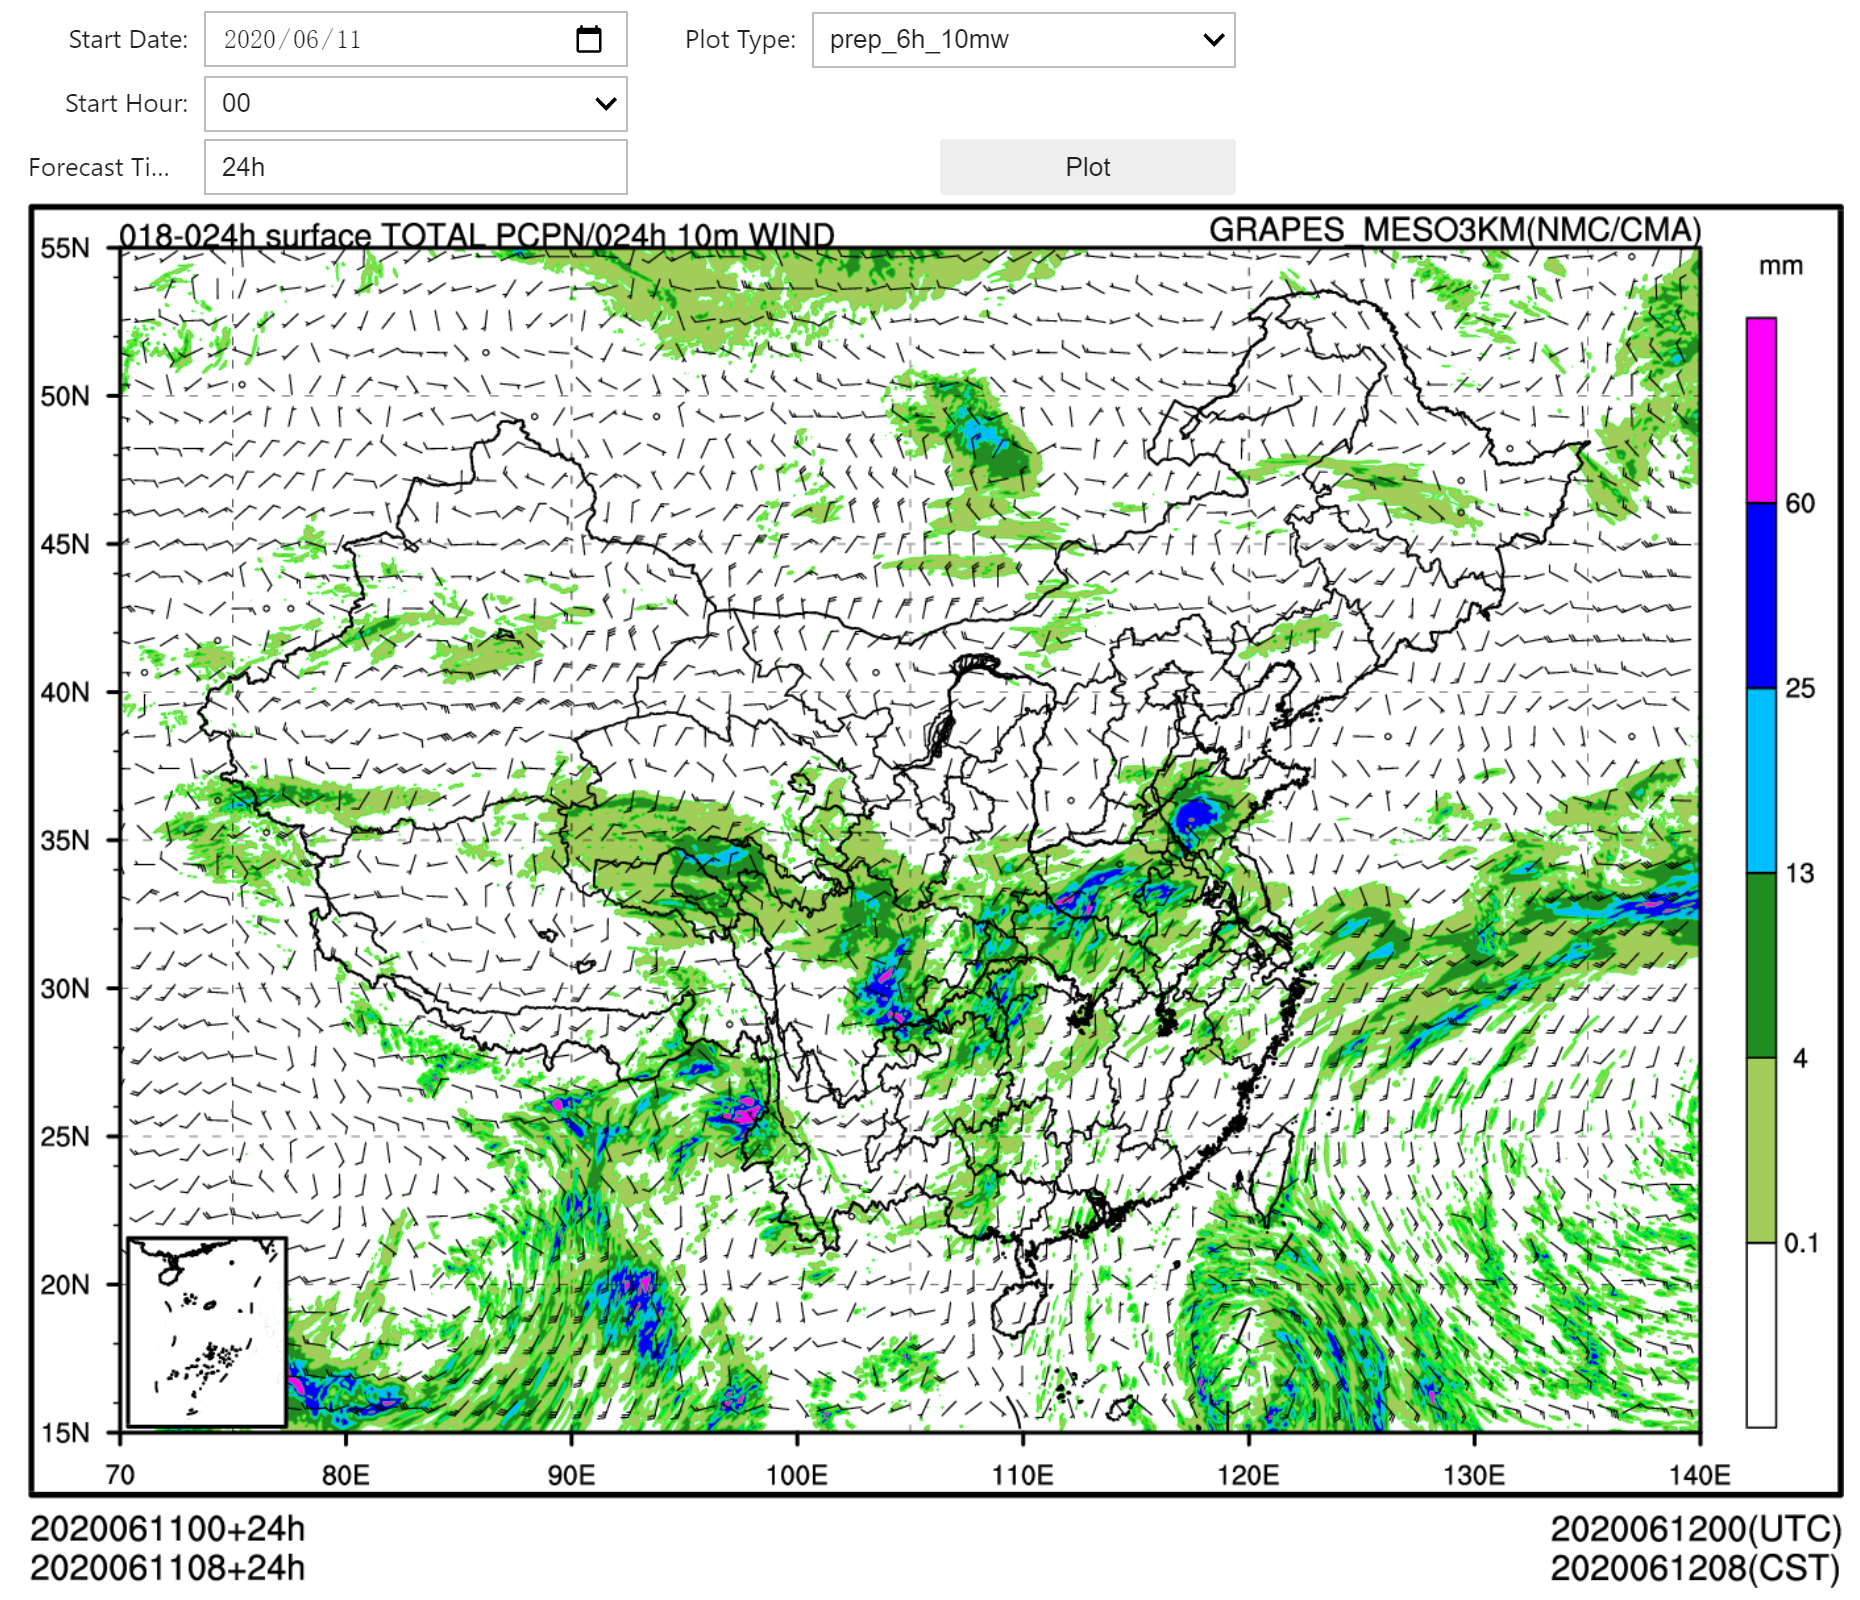
效果
nwpc-graphics 已集成 Jupyter Notebook 交互控件。
from nwpc_graphics.tool import interactive_ui

interactive_ui("grapes_meso_3km")
参考
nwpc-oper/nwpc-graphics
https://github.com/nwpc-oper/nwpc-graphics
Jupyter Widgets 文档
