Bokeh教程:图和网络图
本文翻译自 bokeh/bokeh-notebooks 项目,并经过修改。
本章将介绍如何使用 NetwortkX 在 Bokeh 中绘制网络节点/链接图。 有关从底层创建图形渲染器的信息,请参见可视化网络图
from bokeh.io import output_notebook, show
from bokeh.plotting import figure
output_notebook()
从 NetworkX 绘图
用 Bokeh 绘制网络图的最简单方法是使用 from_networkx 函数。
该函数接受任何 NetworkX 图形,并返回可以添加到绘图中的 Bokeh GraphRenderer。 GraphRenderer 具有 node_renderer 和 edge_renderer 属性,这些属性包含分别绘制节点和边的 Bokeh 渲染器。
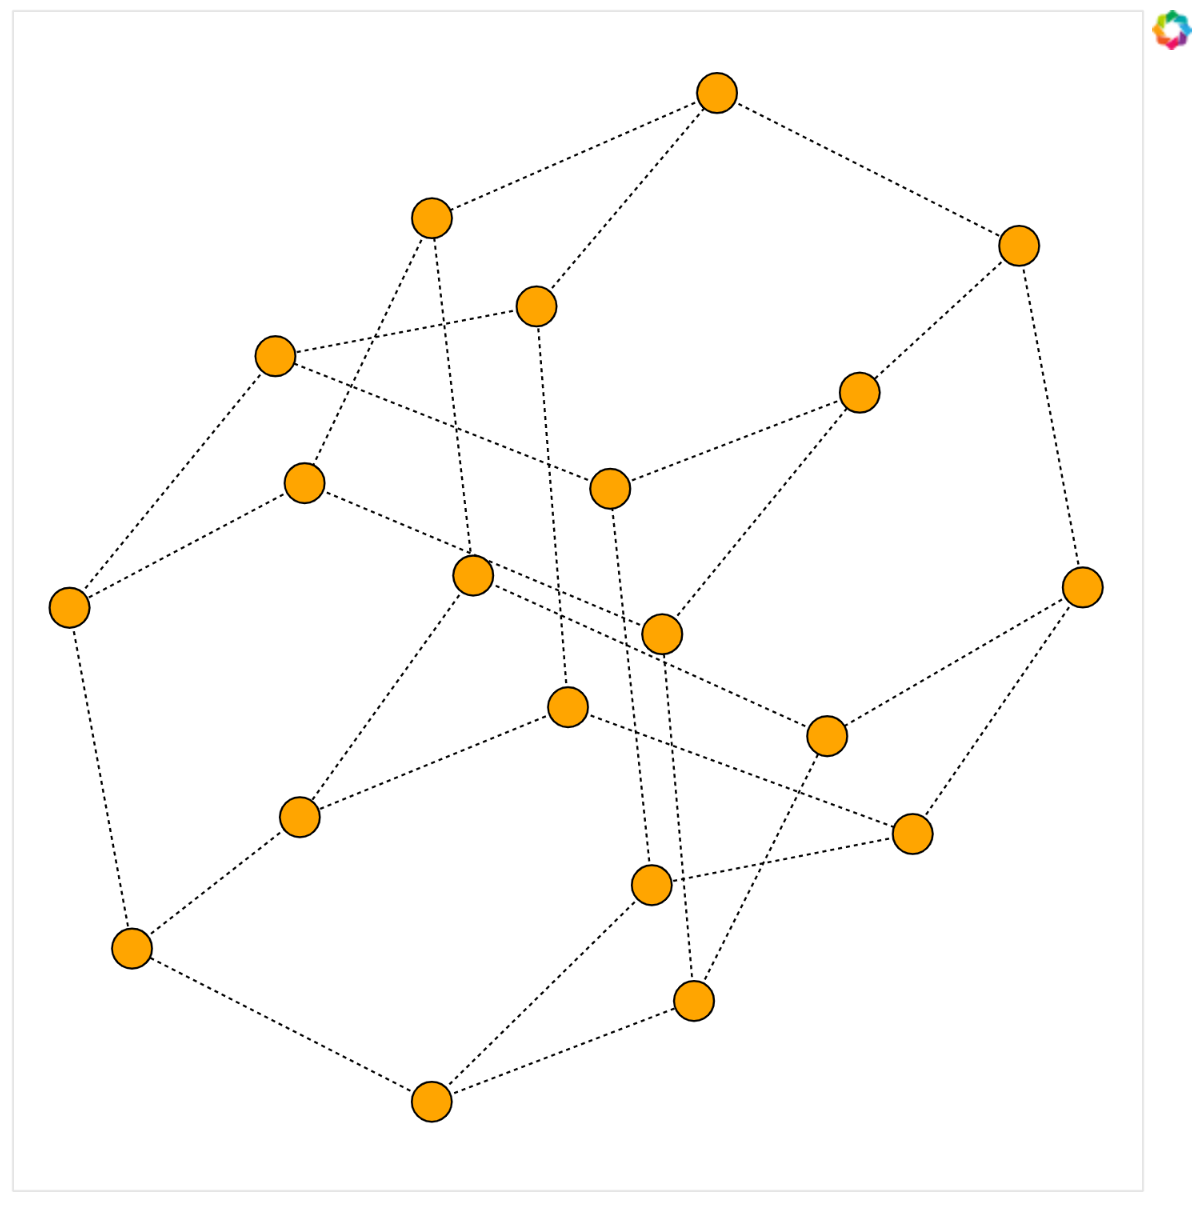
下面的示例显示了 nx.desargues_graph() 的 Bokeh 绘图,它设置了一些节点和边属性。
import networkx as nx
from bokeh.models import Range1d, Plot
from bokeh.plotting import from_networkx

G = nx.desargues_graph()

# 我们可以在这里使用 figure,但不要所有的轴和标题
plot = Plot(
    x_range=Range1d(-2, 2),
    y_range=Range1d(-2, 2)
)

# 使用 nx.spring_layout 从 NetworkX 输入创建 Bokeh 绘图
graph = from_networkx(
    G,
    nx.spring_layout,
    scale=1.8,
    center=(0,0)
)
plot.renderers.append(graph)

# 设置一些默认的节点字形(圆形)属性
graph.node_renderer.glyph.update(
    size=20,
    fill_color="orange"
)

# 设置一些边缘属性
graph.edge_renderer.glyph.line_dash = [2,2]

show(plot)
练习
尝试使用不同的 NetworkX 布局,并在 graph.edgerender.glyph 和 graph.node renderer.glyph 上设置一些属性。
添加额外的数据列
图形渲染器的 node_renderer 和 edge_renderer 属性都有一个 data_source,它是标准的ColumnDataSource,您可以向其中添加新数据。
例如,驱动悬停工具或为渲染器指定颜色。
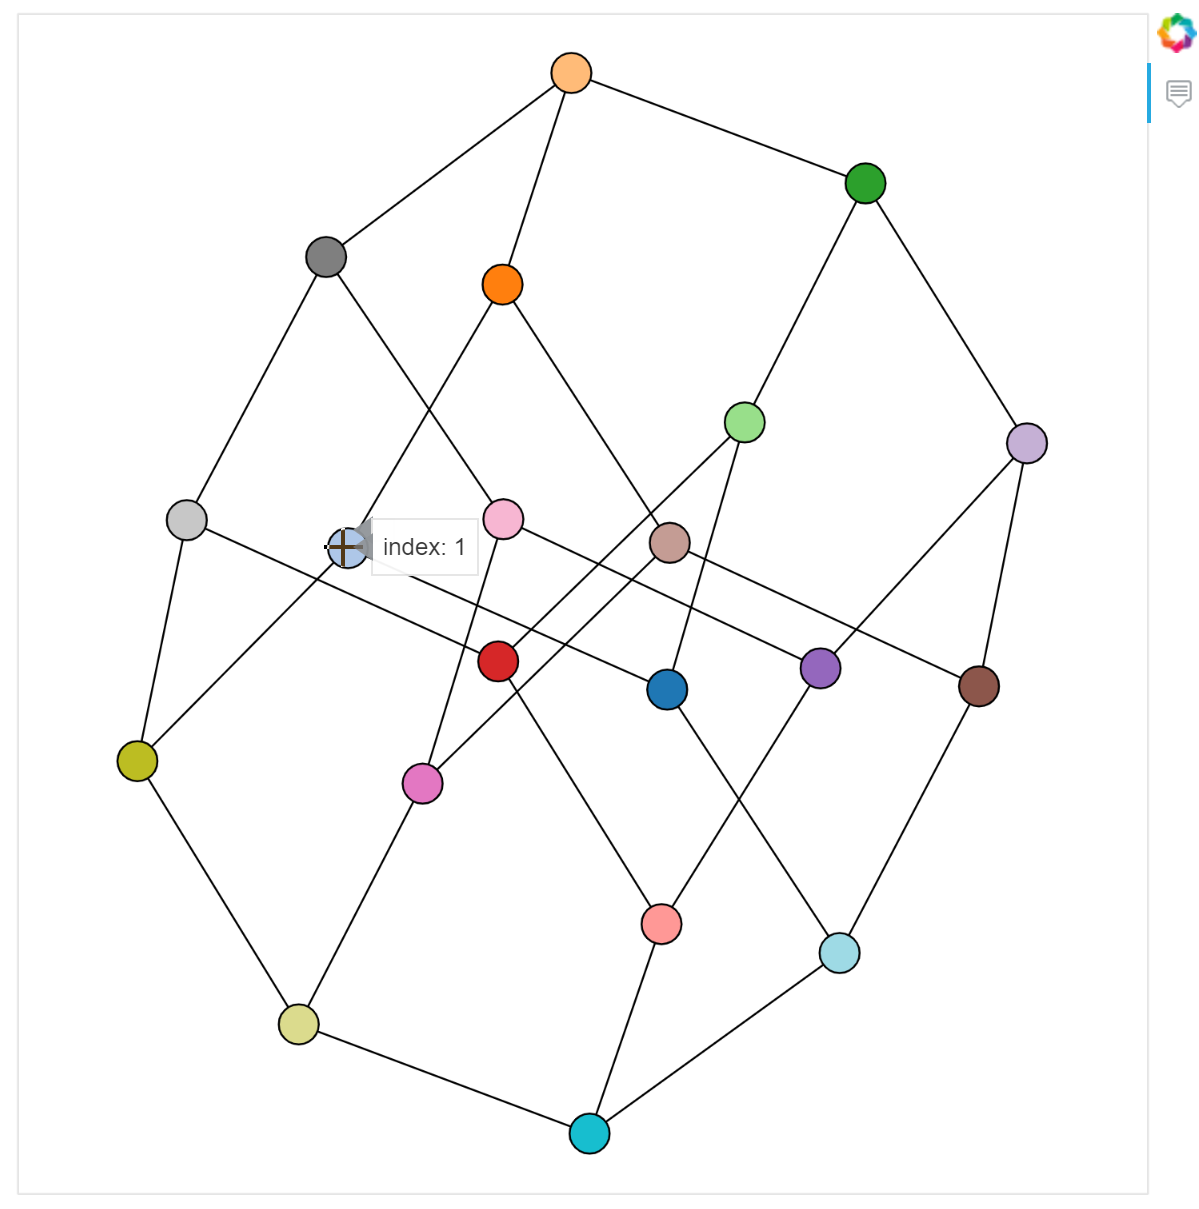
下面的示例演示了两者。
from bokeh.models import HoverTool
from bokeh.palettes import Category20_20

G = nx.desargues_graph() # always 20 nodes

# 我们可以在这里使用 figure,但不要所有的轴和标题
plot = Plot(
    x_range=Range1d(-2, 2),
    y_range=Range1d(-2, 2)
)

# 使用 nx.spring_layout 从 NetworkX 输入创建 Bokeh 绘图
graph = from_networkx(
    G,
    nx.spring_layout,
    scale=1.8,
    center=(0,0)
)
plot.renderers.append(graph)

# 向节点渲染器数据源添加一些新列
graph.node_renderer.data_source.data['index'] = list(range(len(G)))
graph.node_renderer.data_source.data['colors'] = Category20_20

graph.node_renderer.glyph.update(
    size=20,
    fill_color="colors"
)

plot.add_tools(
    HoverTool(
        tooltips="index: @index"
    )
)

show(plot)
练习
为其他节点或边属性添加自己的列,例如 fill_alpha 或 line_color,或显示工具提示中的其他字段
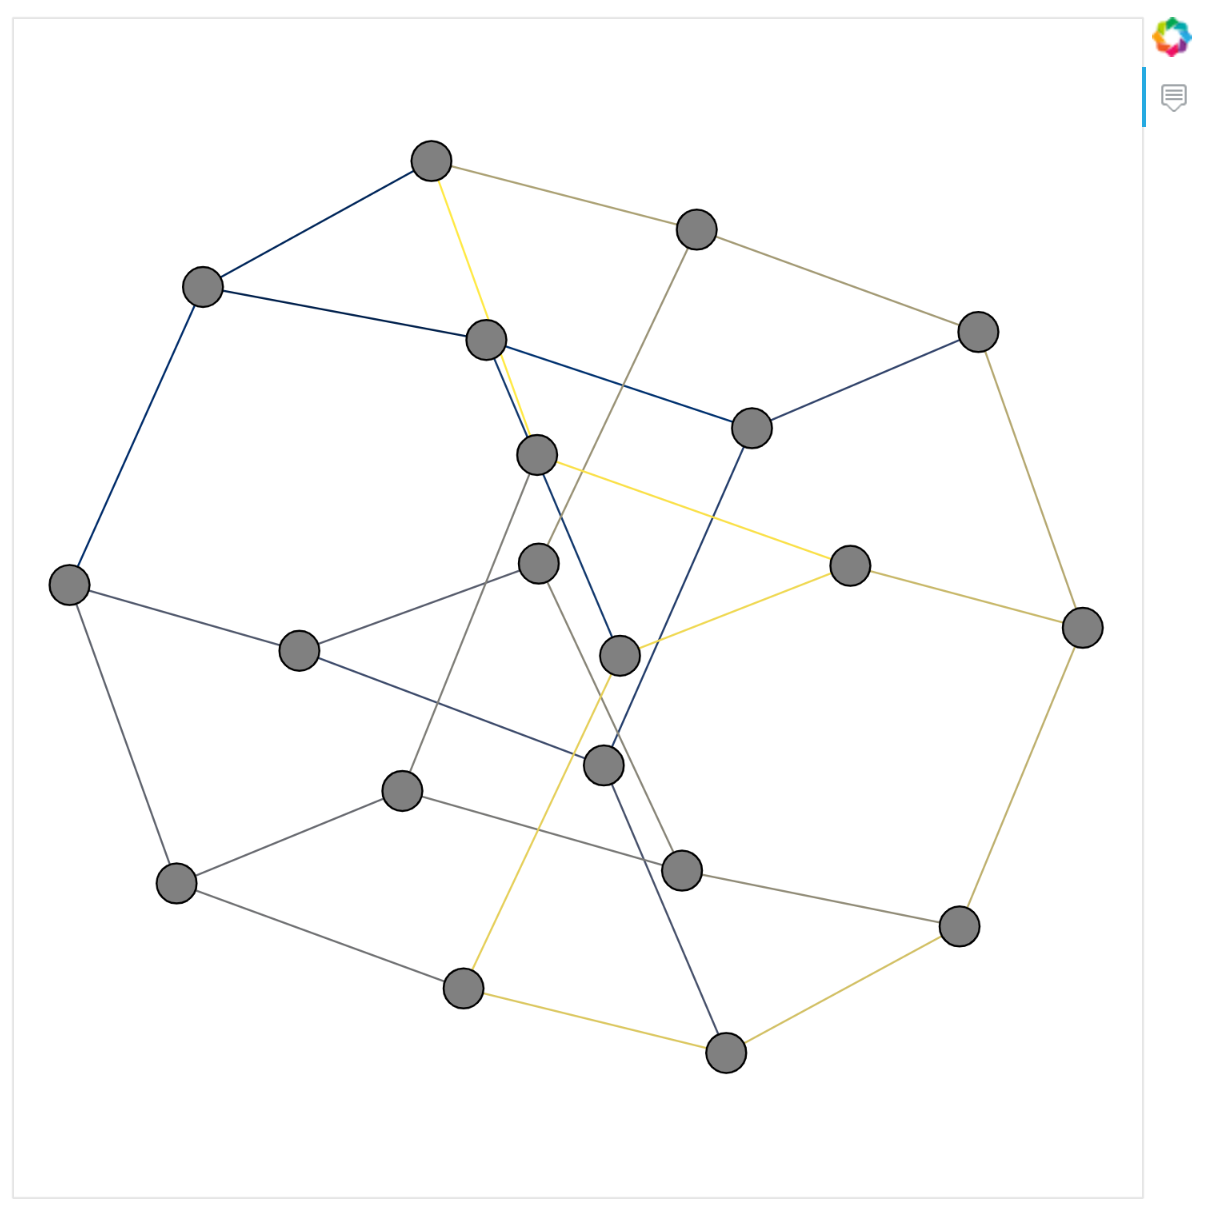
from bokeh.palettes import cividis

G = nx.desargues_graph()

plot = Plot(
    x_range=Range1d(-2, 2),
    y_range=Range1d(-2, 2)
)

graph = from_networkx(
    G,
    nx.spring_layout,
    scale=1.8,
    center=(0,0)
)
plot.renderers.append(graph)

graph.edge_renderer.data_source.data['colors'] = cividis(30)
graph.edge_renderer.glyph.update(
    line_color="colors"
)

graph.node_renderer.glyph.update(
    size=20,
)

plot.add_tools(
    HoverTool(
        tooltips="index: @index"
    )
)

show(plot)
检验和选择政策
Bokeh 渲染器具有 inspection_policy 和 selection_policy 属性,可用于控制悬停检查如何突出显示图形或选择工具如何进行选择。
这些属性可以设置为 bokeh.graphs 中的任何保护策略。
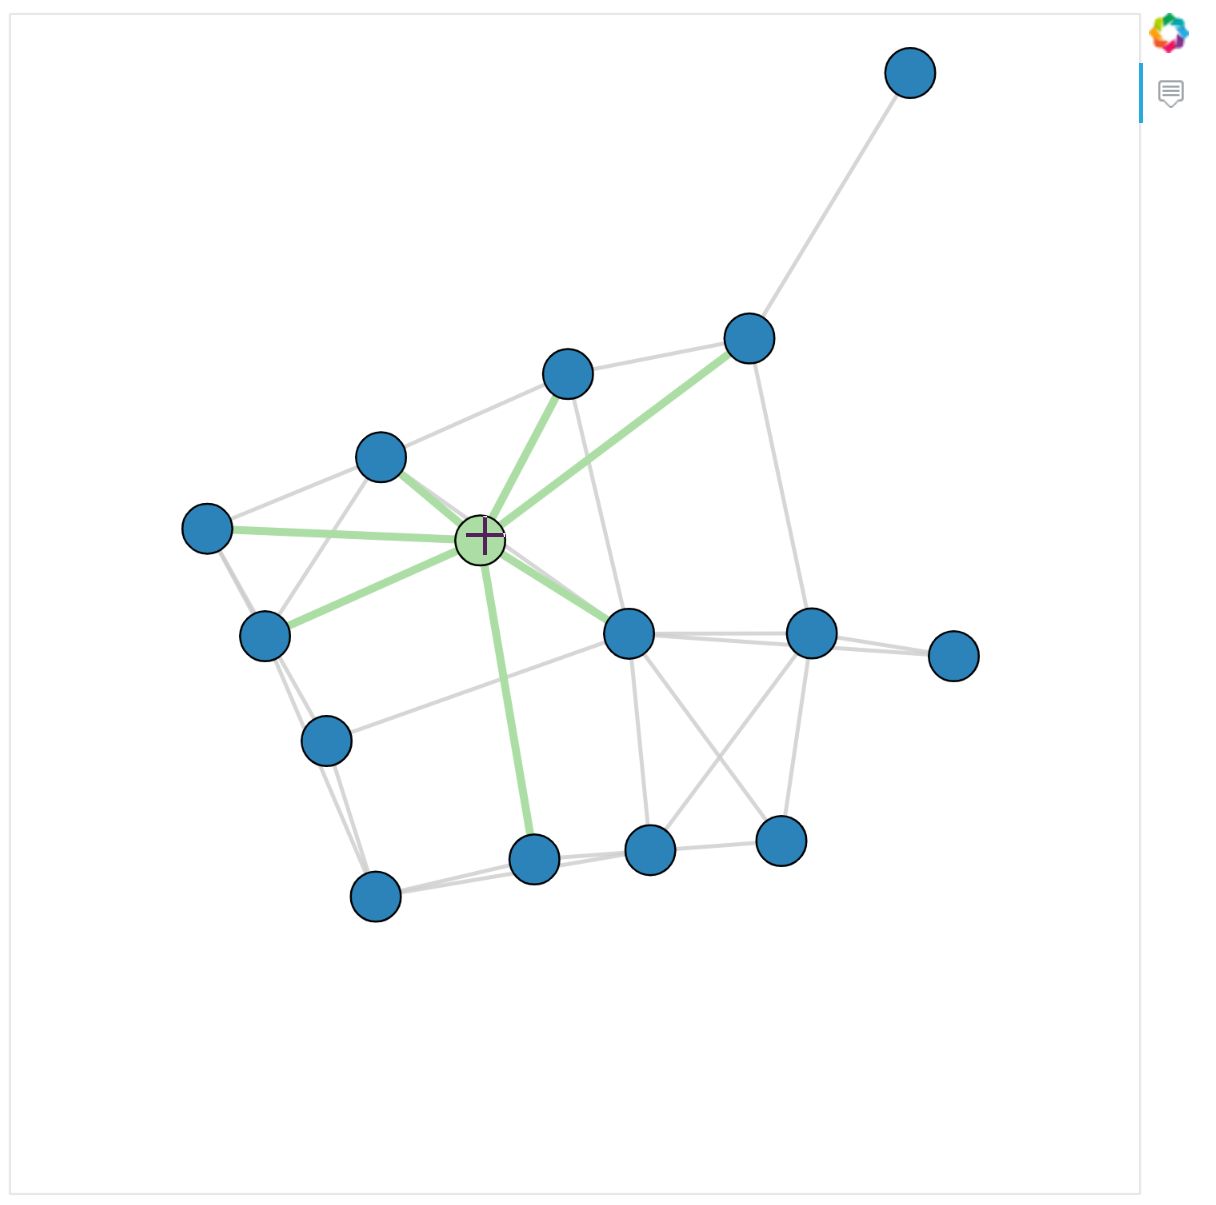
例如,如果用户将鼠标悬停在某个节点上,您可能还希望突出显示所有关联的边,可以通过设置检查策略来完成:
graph.inspection_policy = NodesAndLinkedEdges()
如下例所示。
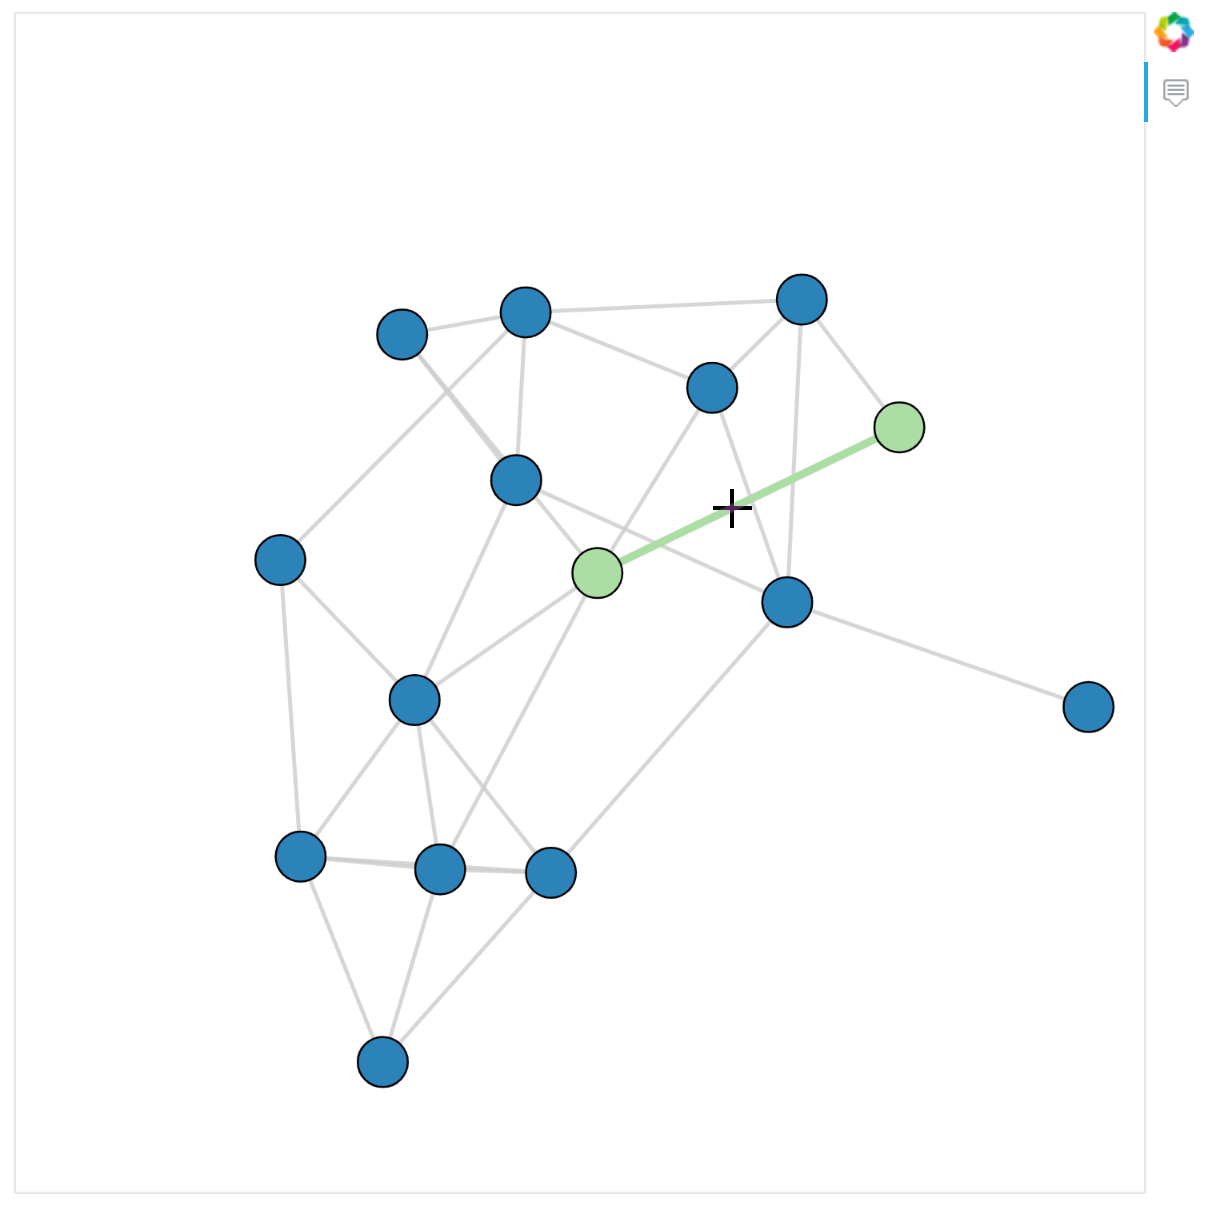
from bokeh.models.graphs import NodesAndLinkedEdges
from bokeh.models import Circle, HoverTool, MultiLine

G = nx.gnm_random_graph(15, 30)

plot = Plot(
    x_range=Range1d(-2, 2),
    y_range=Range1d(-2 ,2)
)

graph = from_networkx(
    G,
    nx.spring_layout,
    scale=1.8,
    center=(0,0)
)
plot.renderers.append(graph)

# 节点为蓝色圆圈,边为浅灰色线
graph.node_renderer.glyph = Circle(
    size=25,
    fill_color='#2b83ba'
)
graph.edge_renderer.glyph = MultiLine(
    line_color="#cccccc",
    line_alpha=0.8,
    line_width=2
)

# 节点和边为绿色悬停
graph.node_renderer.hover_glyph = Circle(
    size=25,
    fill_color='#abdda4'
)
graph.edge_renderer.hover_glyph = MultiLine(
    line_color='#abdda4',
    line_width=4
)

# 悬停在节点上时,同时高亮显示邻接的边
graph.inspection_policy = NodesAndLinkedEdges()

plot.add_tools(HoverTool(tooltips=None))

show(plot)
练习
尝试其他检查(或选择)策略,如 NodesOnly 或 EdgesAndLinkedNodes
from bokeh.models.graphs import EdgesAndLinkedNodes
from bokeh.models import Circle, HoverTool, MultiLine

G = nx.gnm_random_graph(15, 30)

plot = Plot(
    x_range=Range1d(-2, 2),
    y_range=Range1d(-2 ,2)
)

graph = from_networkx(
    G,
    nx.spring_layout,
    scale=1.8,
    center=(0,0)
)
plot.renderers.append(graph)

# 节点为蓝色圆圈,边为浅灰色线
graph.node_renderer.glyph = Circle(
    size=25,
    fill_color='#2b83ba'
)
graph.edge_renderer.glyph = MultiLine(
    line_color="#cccccc",
    line_alpha=0.8,
    line_width=2
)

# 节点和边为绿色悬停
graph.node_renderer.hover_glyph = Circle(
    size=25,
    fill_color='#abdda4'
)
graph.edge_renderer.hover_glyph = MultiLine(
    line_color='#abdda4',
    line_width=4
)

# 悬停在节点上时,同时高亮显示邻接的边
graph.inspection_policy = EdgesAndLinkedNodes()

plot.add_tools(HoverTool(tooltips=None))

show(plot)