Matplotlib中使用Latex格式化文本
目录
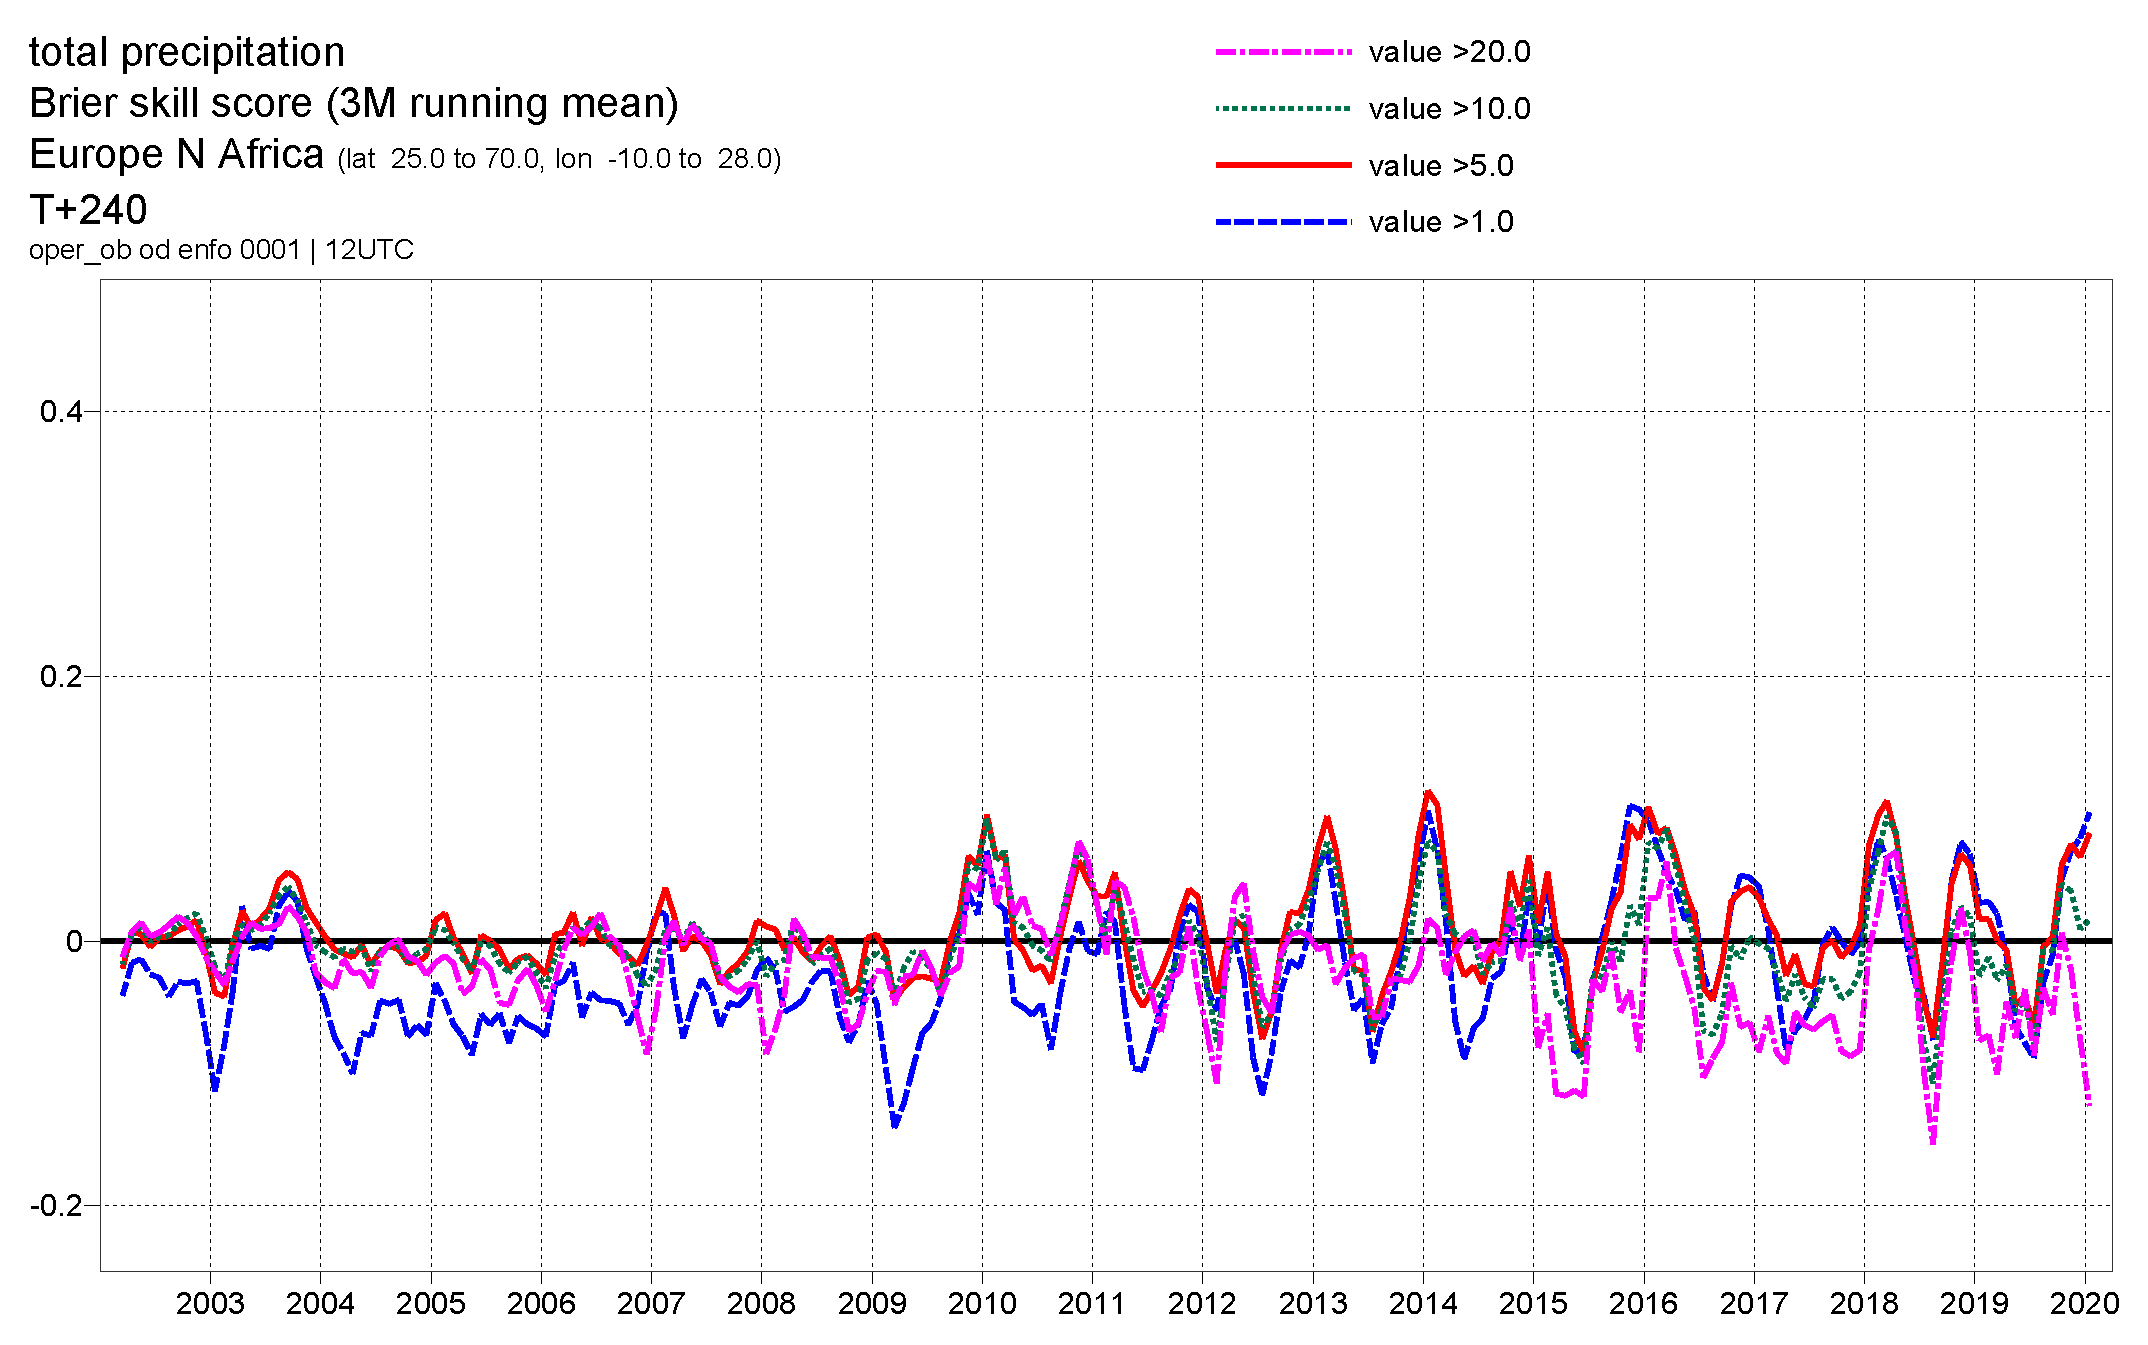
最近同事在研究使用 Matplotlib 如何绘制类似下面的统计图形,主要借鉴其中的标注。 难点在于标题由不同大小的多行文字构成。

来自 ECMWF 网站的示例图片
笔者推测上面的图形使用 ECMWF 自己开发的绘图库 Magics 绘制。
Magics 文本
Magics 中的文本显示支持基本的 HTML 标签。
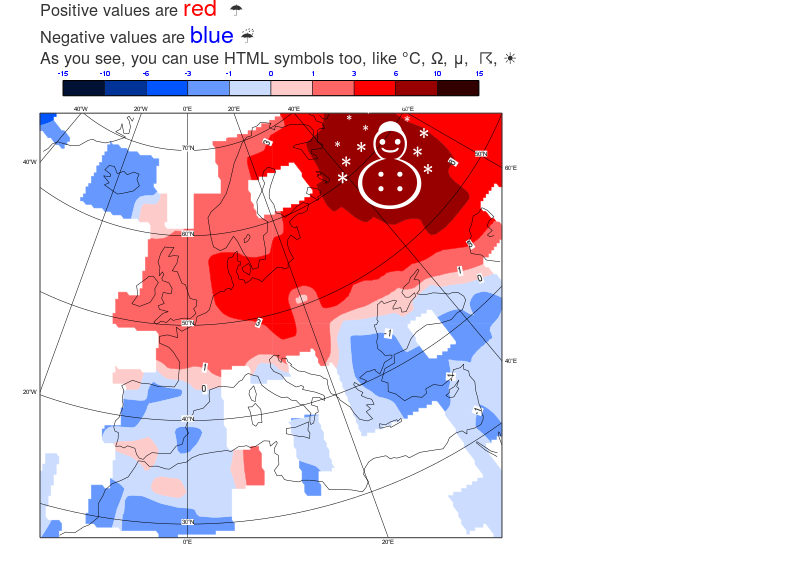
例如在 Text plotting tutorial 中的示例。
title = magics.mtext(
    text_lines = [
        "Positive values are <font colour='red'  size='1'>red  </font>  ☂",
        "Negative values are <font colour='blue' size='1'>blue </font>   ☔",
        "As you see, you can use HTML symbols too, like °C, Ω, μ,  ☈, ☀"
    ],
    text_justification = "left",
    text_font_size     = 0.7,
    text_colour        = "charcoal")

snowman = magics.mtext(
    text_lines          = ["☃"],
    text_mode           = "positional",
    text_box_x_position = 12.,
    text_box_y_position = 12.,
    text_box_x_length   = 10,
    text_box_y_length   = 10,
    text_justification  = "left",
    text_font_size      = 5.7,
    text_colour         = "white")

magics.plot(projection, ta, cont_anomaly, coast, legend, title,snowman)
但遗憾的是,Matplotlib 似乎不支持 HTML 标签。 不过有替代方案。
使用 Latex
Matplotlib 支持使用 Latex 处理文本。 参见 Text rendering With LaTeX。
注意:需要额外安装 Latex 工具。
使用如下的代码启用 Latex 功能。
import matplotlib.pyplot as plt
from matplotlib import rc

rc('font',**{'family':'sans-serif','sans-serif':['Helvetica']})
rc('text', usetex=True)
下面假设已使用 nwpc-data 库从 GRIB 2 文件中加载 850hPa 的温度场,保存到 t850 变量中。
绘制多行文本。
fig, ax = plt.subplots(figsize=(10, 5))

t850.plot(
    ax=ax
)
plt.title(
    "",
)

text = r"""\LARGE{temperature}
\Large{GRAPES GFS GMF} \normalsize{(2020041900)}
\Large{t + 024h}"""

ax.text(
    0, 1, text,
    horizontalalignment='left',
    verticalalignment='bottom',
    transform=ax.transAxes,
)
plt.show()
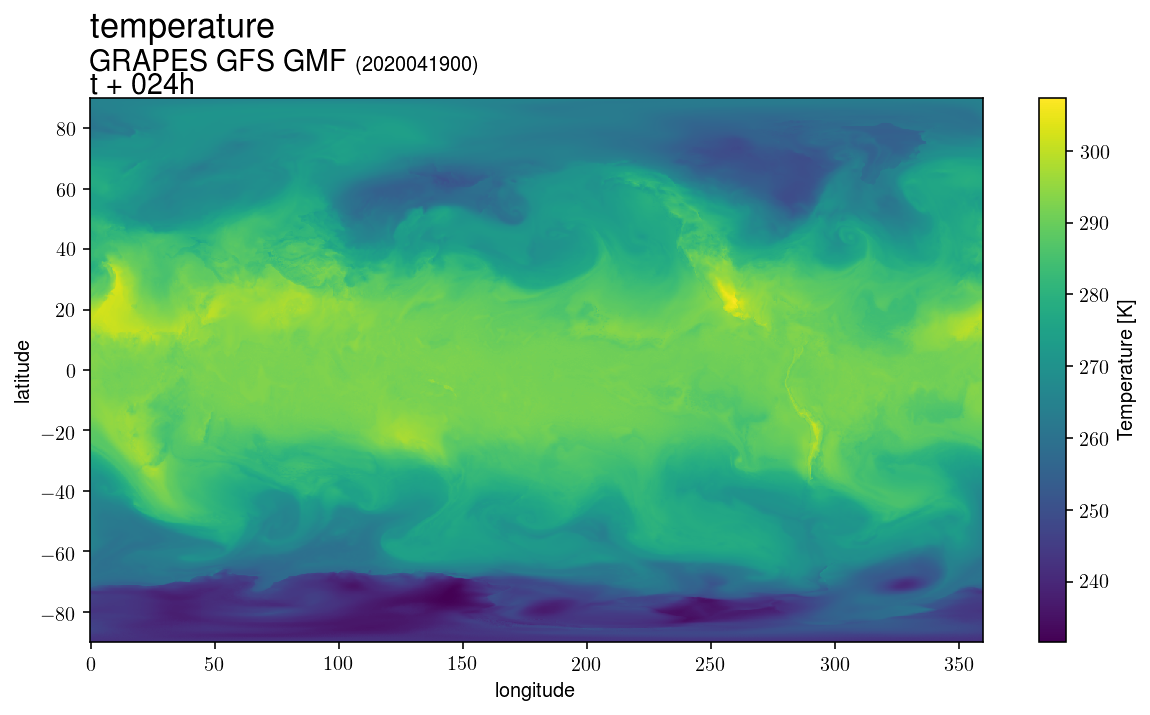
可以获得类似第一张图片的多行显示效果。
参考
nwpc-oper/nwpc-data
https://github.com/nwpc-oper/nwpc-data
Magics: Text plotting tutorial
https://confluence.ecmwf.int/display/MAGP/Text+plotting+tutorial
Matplotlib: Text rendering With LaTeX
