NWPC笔记:获取模式积分时长 - 恒定步长
在《统计数值天气预报模式积分运行时间》中,笔者介绍使用 ecFlow 日志统计模式积分运行时间的统计结果,仅能展示模式积分的总体时长和时间段,缺乏积分步的细节信息。
随后笔者在《统计数值天气预报模式产品生成时间》中介绍使用 NWPC 消息平台统计产品生成的时间,可以略微展现模式积分的部分细节。
但在《统计数值预报产品生成时间:重采样》中可以看到,产品生成时间并不是随着产品时效单调递增的,所以想要获取模式积分的细节信息,还得从模式积分本身入手。
本文介绍如何从模式积分输出中获取模式积分时长,只考虑模式步长恒定的 GRAPES GFS 系统。
声明:本文仅代表作者个人观点,所用数据无法代表真实情况,严禁转载。关于模式系统的相关信息,请以官方发布的信息及经过同行评议的论文为准。
模式积分输出
在模式积分输出的 std.out.0000 文件中,有每个积分步骤的耗时。例如
Timing for processing for step        1:   15.51460 elapsed seconds.
 begin of gcr  6.001155404370011E-005
 RES of gcr  1.006302069134485E-023 in           37 iterations
Timing for processing for step        2:    0.30060 elapsed seconds.
 begin of gcr  5.512293401798762E-005
 RES of gcr  1.112349462442307E-023 in           37 iterations
Timing for processing for step        3:    0.34650 elapsed seconds.
 begin of gcr  5.254961640146931E-005
 RES of gcr  8.206002160154577E-024 in           37 iterations
积分步数和每步耗时有明显的标志,可以使用正则表达式提取。
提取信息
使用下面的函数获取步数和时长。
def get_step_time_from_file(file_path):
    p = re.compile(r"Timing for processing for step\s+(.+):\s+(.+) elapsed seconds\.")
    data = []
    index = []
    with open(file_path) as f:
        for line in f:
            m = p.match(line)
            if m is None:
                continue
            step = int(m.group(1))
            time = float(m.group(2))
            data.append({
                "time": time
            })
            index.append(step)
    df = pd.DataFrame(data, index=index)
    return df
返回的 pandas.DataFrame 对象中包含表示积分时长的 time 列,索引是积分步数,从 1 开始。
获取积分步长
使用 nwpc-oper/nwpc-log-tool 工具获取日志文件地址。
from nwpc_log_tool.data_finder import find_local_file

file_path = find_local_file(
    "grapes_gfs_gmf/log/fcst_long_std_out",
    start_time="2020050500",
)
file_path
PosixPath('/g1/COMMONDATA/OPER/NWPC/GRAPES_GFS_GMF/Log/2020050421/std.out_fcst_2020050500')
获取积分步长
from nwpc_log_tool.forecast_output.grapes_gfs import get_step_time_from_file
df = get_step_time_from_file(file_path)
df.head()

一般不需要检查每个步骤的运行时长,我们关注的重点是整个积分进程是否正常,所以使用 cumsum() 方法计算的累加和更有实际意义。
另外为了绘图方便,将积分步数 step 也添加到数据中。
df["step"] = df.index
df["ctime"] = df["time"].cumsum()
df.head()

绘制统计图形
使用 seaborn 库绘制统计图形
import seaborn as sns
sns.set(style="whitegrid")
折线图
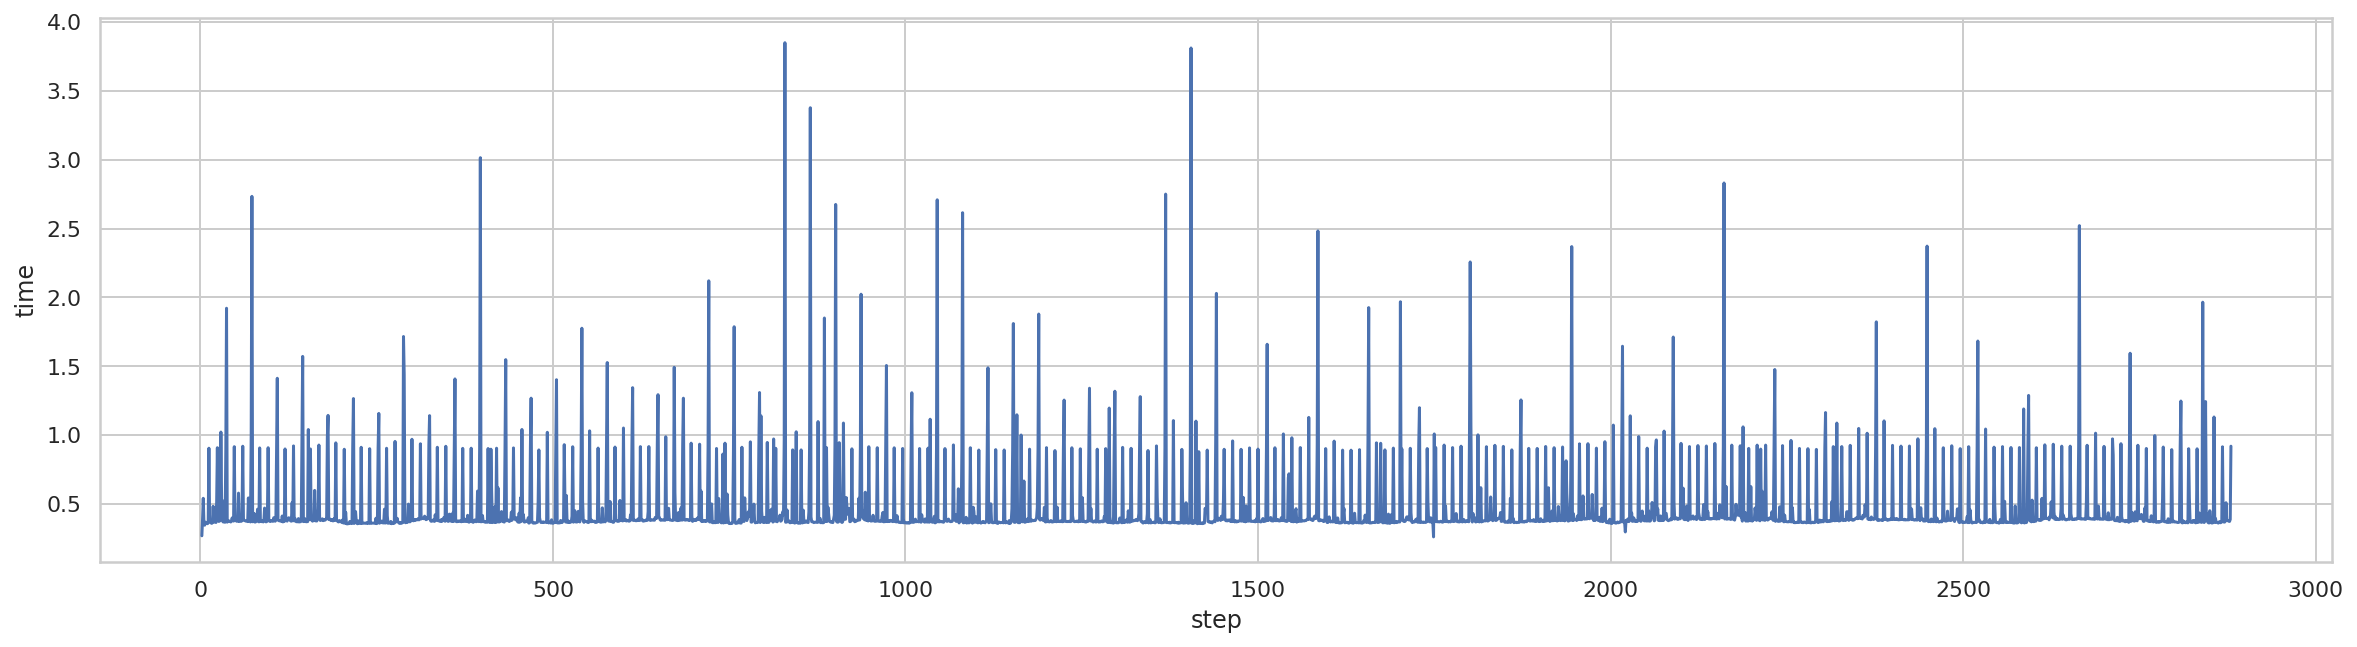
绘制折线图,第一步耗时过长,直接忽略。
fig, ax = plt.subplots(figsize=(20, 5))
sns.lineplot(
    x="step",
    y="time",
    data=df[1:],
    ax=ax
)
直方图
绘制直方图,第一步耗时过长,直接忽略。
fig, ax = plt.subplots(figsize=(10, 5))
sns.distplot(
    df["time"][1:],
    ax=ax
)
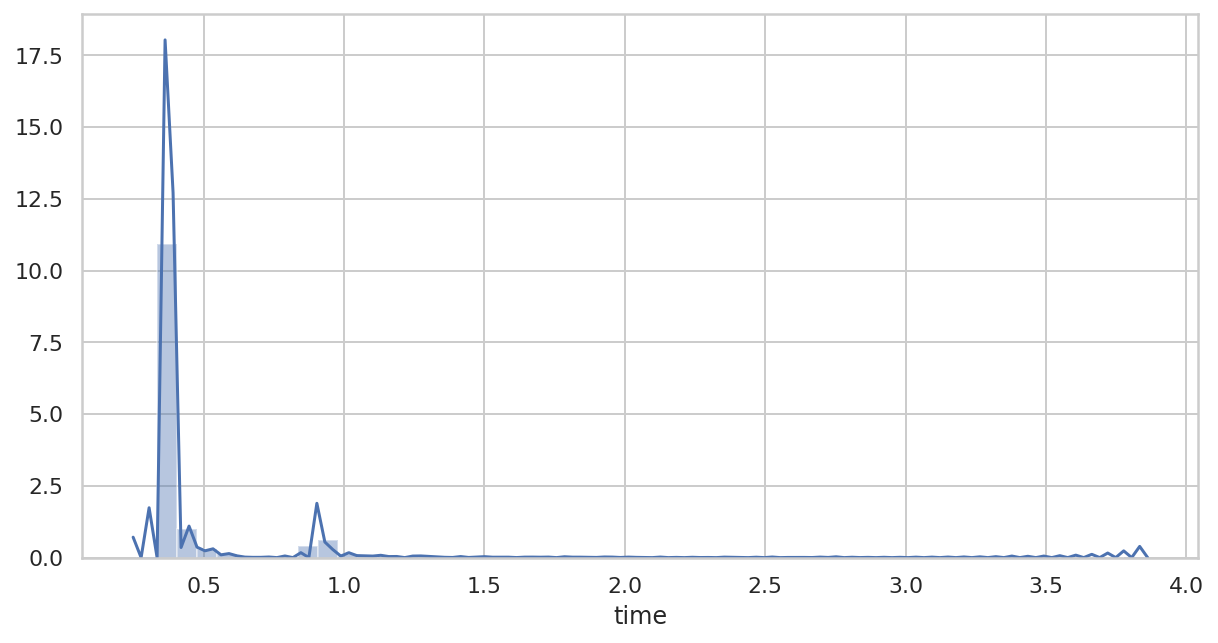
可以看到,大部分步骤的时长都短于 1s,峰值小于 0.5s。
简要分析
所有步骤耗时,单位为分钟
df["time"].sum()/60
22.728208333333335
耗时大于 1 秒的步骤的累计时间,单位为分钟
df["time"][df["time"]>1].sum()/60
2.907325
绝大部分的积分时间都花费在小于 1s 的步骤中,这是一个很合理的时间分配模式。
绘制累计时间折线图
df["ctime"].plot()
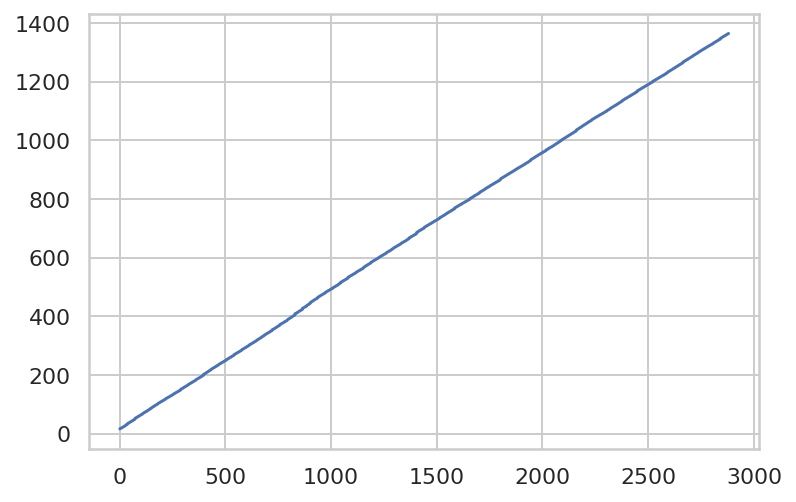
折线图近似于直线,表明积分步数与时间近似于线性关系,说明大于 1s 的步骤对整个积分进程影响很小,示例数据来自一个正常时间范围内的积分过程。
