Bokeh教程:链接与交互
本文翻译自 bokeh/bokeh-notebooks 项目,并经过修改。
from bokeh.io import output_notebook, show
from bokeh.plotting import figure
output_notebook()
现在我们已经从上一章知道了如何在一个布局中将多个图放置在一起,我们可以开始研究如何将不同的图链接到一起,或者如何将图链接到控件。
链接交互
可以链接不同 Bokeh 绘图之间的各种交互操作。 例如,可以链接两个(或多个)图的范围,以便在平移(或缩放)一个图或更改其范围时,其他图将一致更新。 也可以在两个图之间链接选择,以便在一个图上选择项目时,第二个图上的相应项目也将被选择。
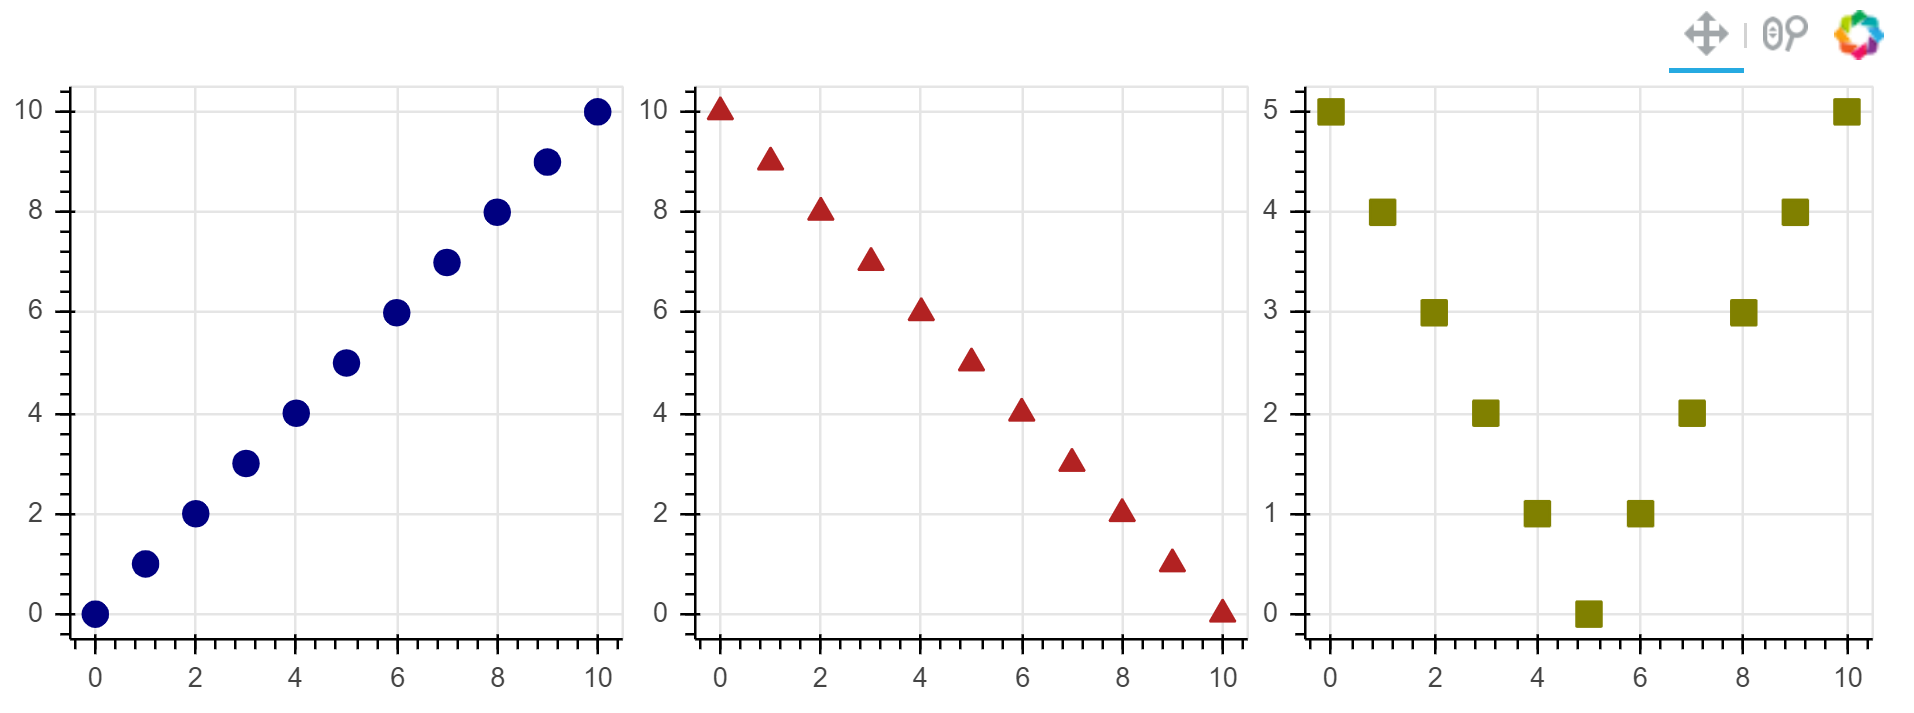
链接平移
链接平移(当多个绘图的范围保持同步时)很容易用 Bokeh 拼写。 您只需在两个(或多个)绘图之间共享适当的范围对象。 以下示例显示了如何通过以各种方式链接三个图的范围来实现此目的:
from bokeh.layouts import gridplot

x = list(range(11))
y0, y1, y2 = x, [10-i for i in x], [abs(i-5) for i in x]

plot_options = dict(
    width=250,
    plot_height=250,
    tools='pan,wheel_zoom'
)

# 创建一个新绘图
s1 = figure(**plot_options)
s1.circle(
    x, y0,
    size=10,
    color="navy"
)

# 创建另一个新绘图,并共享所有区域
s2 = figure(
    x_range=s1.x_range,
    y_range=s1.y_range,
    **plot_options
)
s2.triangle(
    x, y1,
    size=10,
    color="firebrick"
)

# 创建一个新绘图,只共享一个区域
s3 = figure(
    x_range=s1.x_range,
    **plot_options
)
s3.square(
    x, y2,
    size=10,
    color="olive"
)

p = gridplot([[s1, s2, s3]])

# 显示绘图结果
show(p)
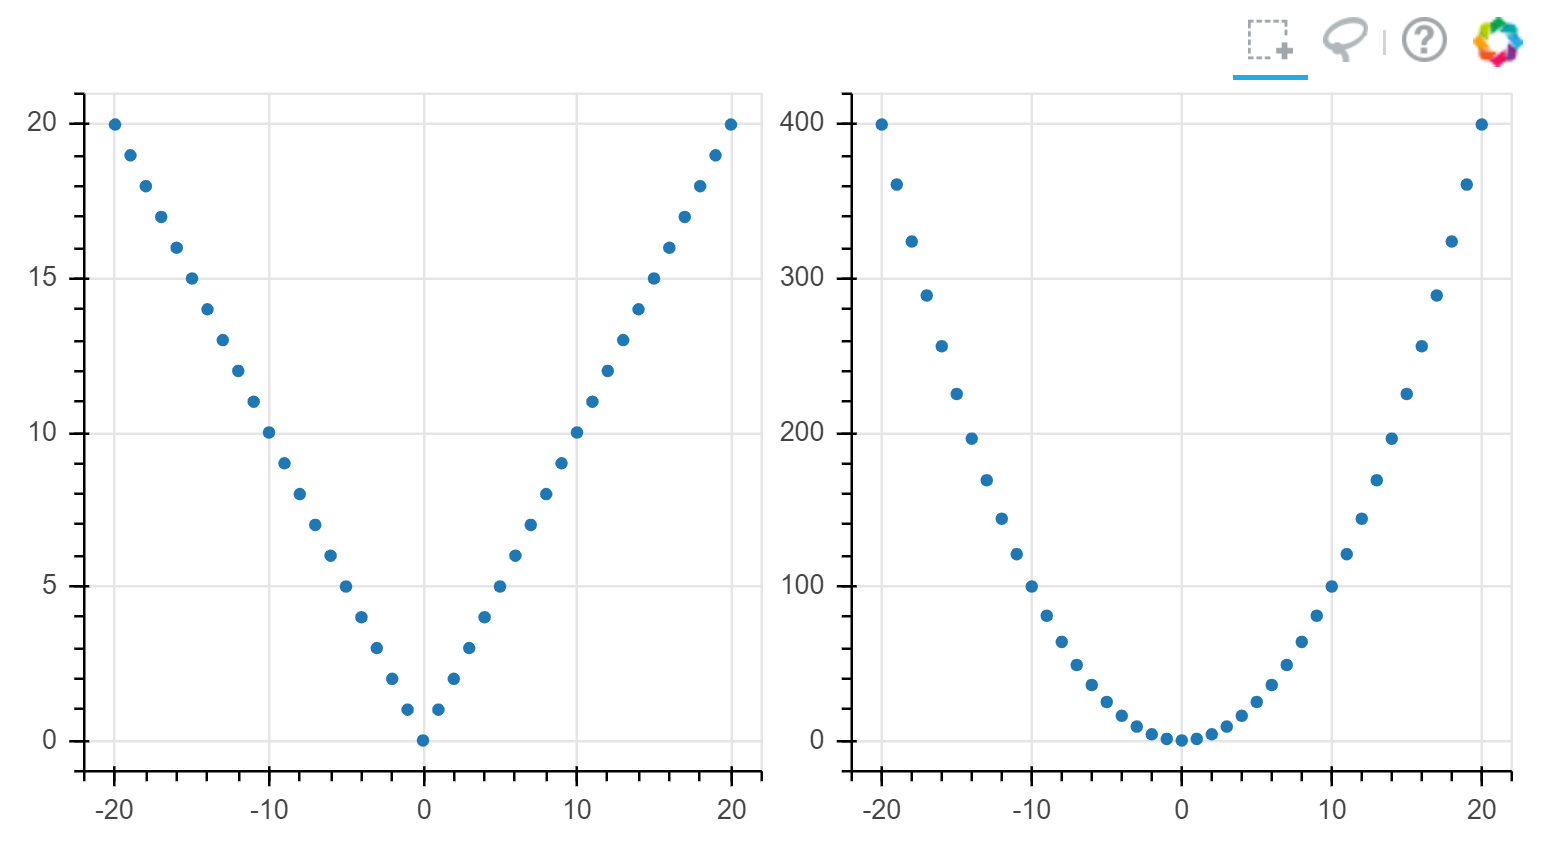
链接刷
链接选择以类似方式完成,通过在绘图之间共享数据源。
请注意,通常使用 bokeh.plotting 和 bokeh.charts 时会自动创建用于简单图的默认数据源。
但是,要共享数据源,我们必须手动创建并显式传递它们。
在下面的示例中对此进行了说明:
from bokeh.models import ColumnDataSource

x = list(range(-20, 21))
y0, y1 = [abs(xx) for xx in x], [xx**2 for xx in x]

# 创建一个列数据源,以便在绘图中共享
source = ColumnDataSource(
    data=dict(x=x, y0=y0, y1=y1)
)

TOOLS = "box_select,lasso_select,help"

# 创建一个新绘图,并添加一个渲染器
left = figure(
    tools=TOOLS,
    width=300,
    height=300
)
left.circle(
    'x', 'y0',
    source=source
)

# 创建另一个绘图,并添加一个渲染器
right = figure(
    tools=TOOLS,
    width=300,
    height=300
)
right.circle(
    'x', 'y1',
    source=source
)

p = gridplot([[left, right]])

show(p)
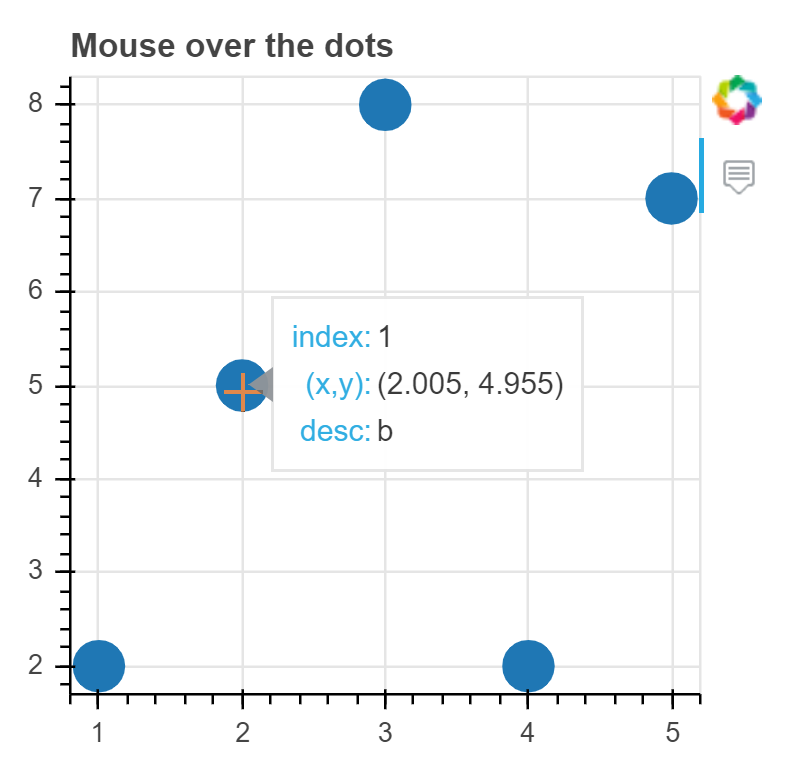
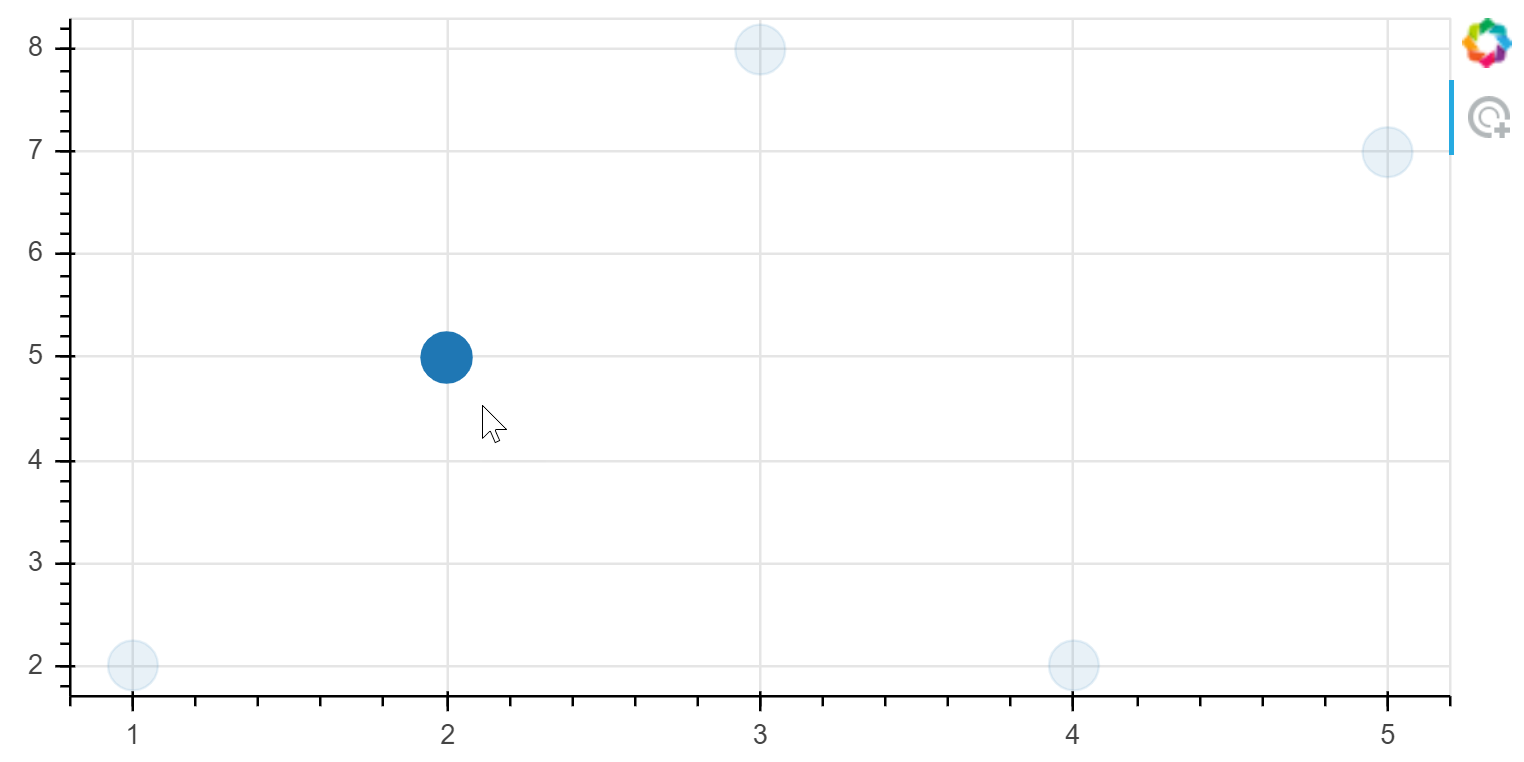
悬停工具
Bokeh 提供悬停工具,每当用户将鼠标悬停在特定 glyph 上时,该工具便会在弹出窗口中显示附加信息。
基本的悬停工具配置相当于提供 (name, format) 元组的列表。
完整的详细信息可以在此处的《用户指南》中找到。
from bokeh.models import HoverTool

source = ColumnDataSource(
    data=dict(
        x=[1, 2, 3, 4, 5],
        y=[2, 5, 8, 2, 7],
        desc=['A', 'b', 'C', 'd', 'E'],
    )
)

hover = HoverTool(
    tooltips=[
        ("index", "$index"),
        ("(x,y)", "($x, $y)"),
        ("desc", "@desc"),
    ]
)

p = figure(
    plot_width=300,
    plot_height=300,
    tools=[hover],
    title="Mouse over the dots"
)

p.circle(
    'x', 'y',
    size=20,
    source=source
)

show(p)
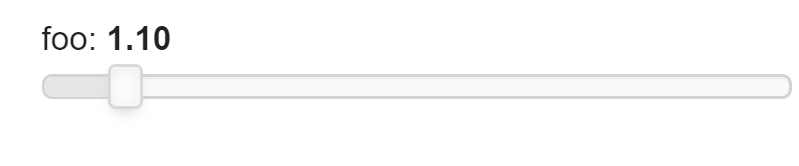
控件
Bokeh 支持与小型基础控件集的直接集成。
它们可以与 Bokeh Server 或 CustomJS 模型结合使用,以向文档添加更多的交互功能。
您可以在《用户指南》的“添加小部件”部分中看到带有示例代码的完整列表。
注意:在本教程章节中,我们将重点介绍将控件与 JavaScript 回调一起使用。 Bokeh 服务器应用程序的教程章节涵盖了将 Bokeh 控件与真正的 Python 回调一起使用。
要使用控件,请将它们包括在布局中,就像绘制对象一样:
from bokeh.models.widgets import Slider

slider = Slider(
    start=0,
    end=10,
    value=1,
    step=.1,
    title="foo"
)

show(slider)
CustomJS 回调
为了使控件有用,它需要能够执行某些操作。
使用 Bokeh 服务器,可以使小部件触发真实的 Python 代码。
这种可能性将在教程的 Bokeh 服务器一章中探讨。
在这里,我们看一下如何配置使用 CustomJS 回调的控件,执行 JavaScript 代码段。
from bokeh.models import (
    TapTool,
    CustomJS,
    ColumnDataSource
)

callback = CustomJS(
    code="alert('you tapped a circle!')"
)
tap = TapTool(callback=callback)

p = figure(
    plot_width=600,
    plot_height=300,
    tools=[tap]
)

p.circle(
    x=[1, 2, 3, 4, 5],
    y=[2, 5, 8, 2, 7],
    size=20
)

show(p)
CustomJS 属性修改
具有关联值的 Bokeh 对象可以使用 js_on_change 方法附加一些小的 JavaScript 操作。
每当更改窗口控件的值时,就会执行这些操作(也称为“回调”)。
为了更轻松地从 JavaScript 引用特定的 Bokeh 模型(例如,数据源或 glyhph),CustomJS 对象还接受 “args”字典,该字典将名称映射到 Python Bokeh 模型。
相应的 JavaScript 模型可自动用于 CustomJS 代码:
CustomJS(args=dict(source=source, slider=slider), code="""
    // easily refer to BokehJS source and slider objects in this JS code
    var data = source.data;
    var f = slider.value;
""")
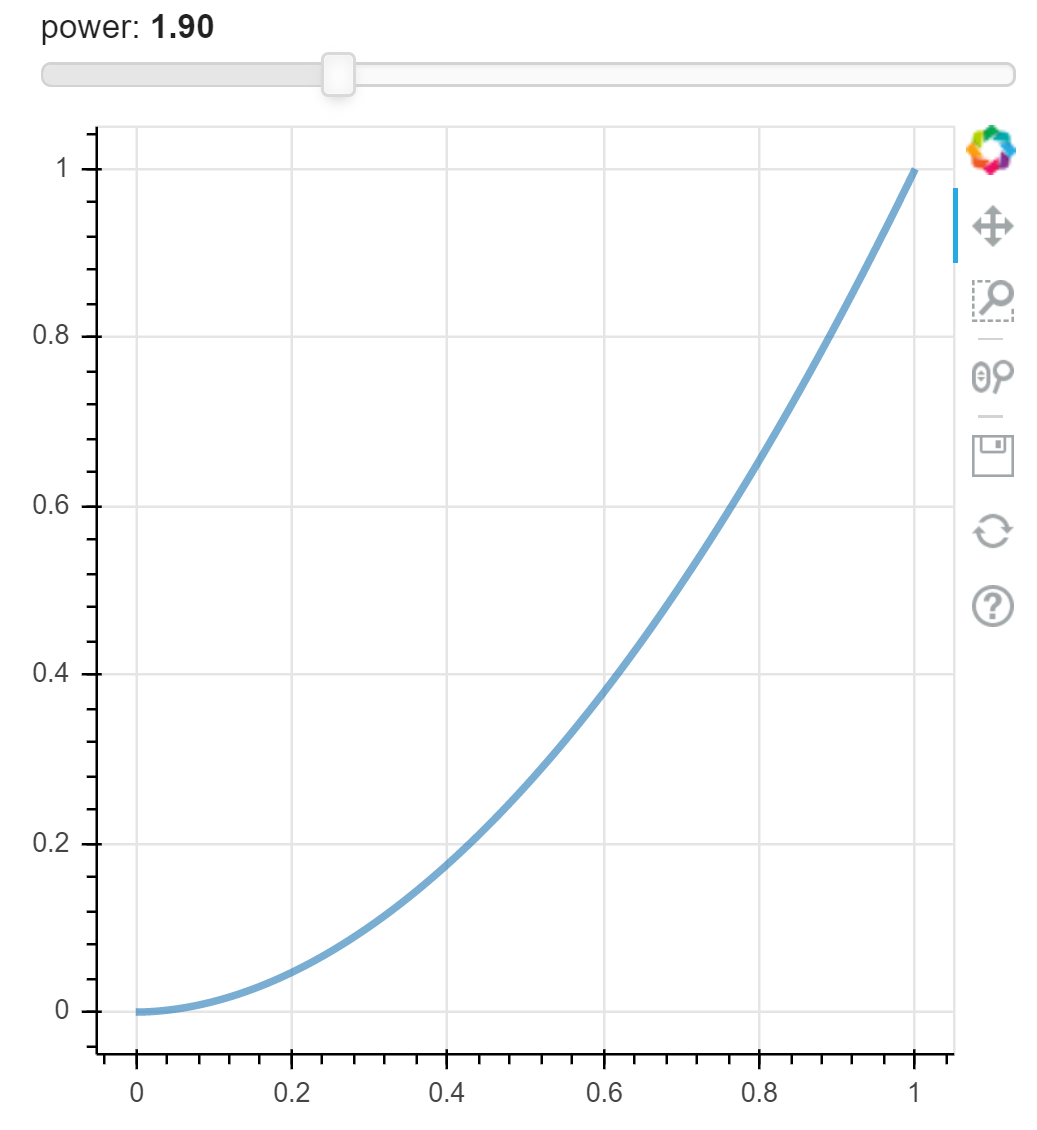
Slider 控件示例
下面的示例显示了附加到 slide 的动作,该动作在滑块移动时都会更新数据源。
from bokeh.layouts import column
from bokeh.models import (
    CustomJS,
    ColumnDataSource,
    Slider,
)

x = [x*0.005 for x in range(0, 201)]

source = ColumnDataSource(data=dict(x=x, y=x))

plot = figure(
    plot_width=400,
    plot_height=400
)
plot.line(
    'x', 'y',
    source=source,
    line_width=3,
    line_alpha=0.6
)

slider = Slider(
    start=0.1,
    end=6,
    value=1,
    step=.1,
    title="power"
)

update_curve = CustomJS(
    args=dict(source=source, slider=slider),
    code="""
    var data = source.data;
    var f = slider.value;
    var x = data['x']
    var y = data['y']
    for (var i = 0; i < x.length; i++) {
        y[i] = Math.pow(x[i], f)
    }

    // necessary becasue we mutated source.data in-place
    source.change.emit();
""")
slider.js_on_change('value', update_curve)


show(column(slider, plot))
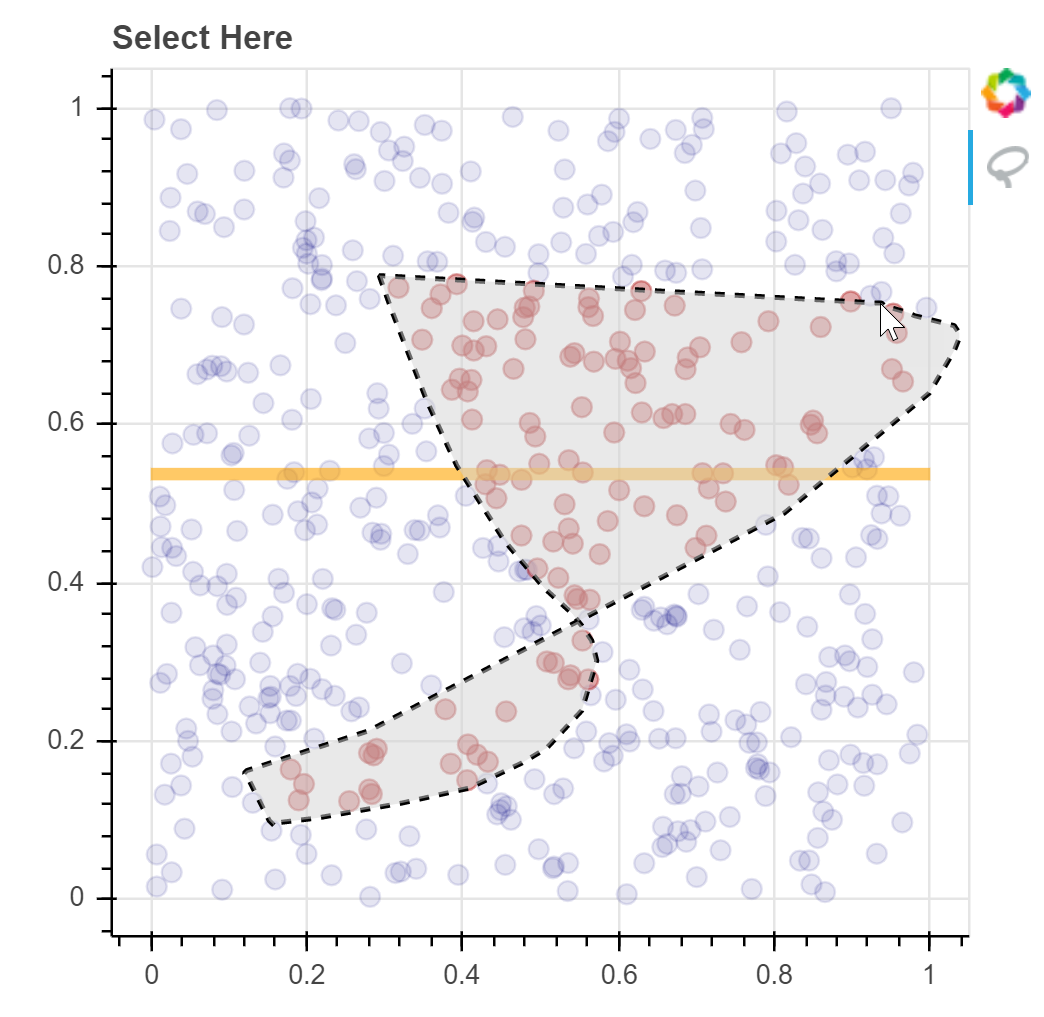
数据选择示例
每当用户选择(例如,框,点,套索)更改时,也可以执行 JavaScript 操作。 这是通过将相同种类的 CustomJS 对象附加到进行选择的任何数据源来完成的。
下面的示例稍微复杂一些,并演示了如何根据一个 glyph 的选择来更新另一个 glyph 的数据源:
from random import random

x = [random() for x in range(500)]
y = [random() for y in range(500)]
color = ["navy"] * len(x)

s1 = ColumnDataSource(
    data=dict(x=x, y=y, color=color)
)
p = figure(
    plot_width=400,
    plot_height=400,
    tools="lasso_select",
    title="Select Here"
)
p.circle(
    'x', 'y',
    color='color',
    size=8,
    alpha=0.4,
    source=s1,
    selection_color="firebrick",
    selection_alpha=0.4
)

s2 = ColumnDataSource(
    data=dict(xm=[0,1],ym=[0.5, 0.5])
)
p.line(
    x='xm',
    y='ym',
    color="orange",
    line_width=5,
    alpha=0.6,
    source=s2
)

callback = CustomJS(
    args=dict(s1=s1, s2=s2),
    code="""
    var inds = s1.selected.indices;
    if (inds.length == 0)
        return;

    var ym = 0
    for (var i = 0; i < inds.length; i++) {
        ym += s1.data.y[inds[i]]
    }

    ym /= inds.length
    s2.data.ym = [ym, ym]

    // necessary becasue we mutated source.data in-place
    s2.change.emit();
""")

s1.selected.js_on_change('indices', callback)

show(p)
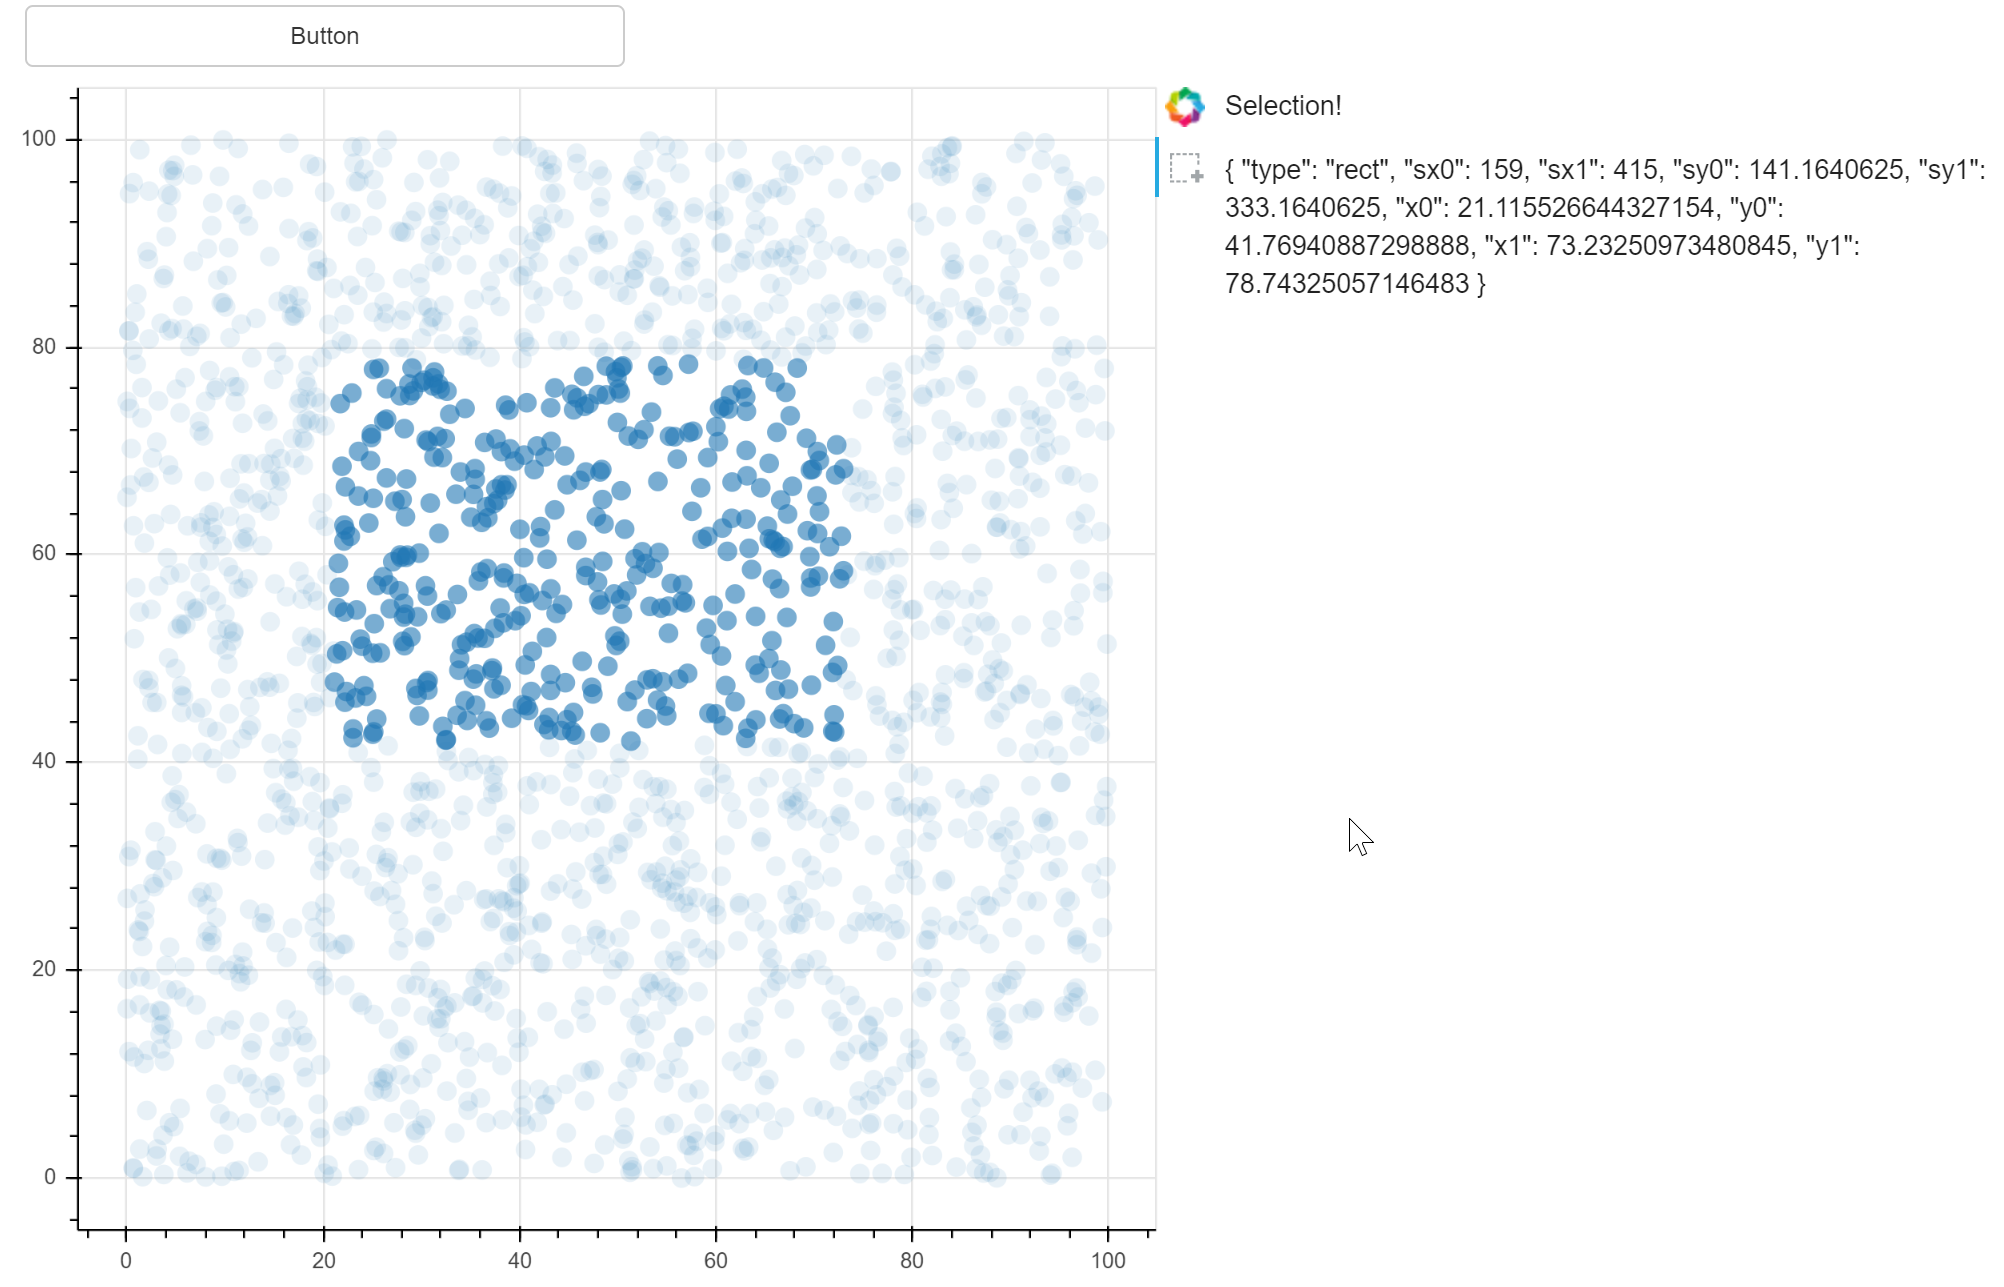
CustomJS UI 时间
Bokeh 也有通用事件系统
在 bokeh.events 的参考指南部分中列出了所有可用的 UI 事件及其属性。
from bokeh.plotting import figure
from bokeh import events
from bokeh.models import CustomJS, Div, Button
from bokeh.layouts import column, row

import numpy as np
x = np.random.random(size=2000) * 100
y = np.random.random(size=2000) * 100

p = figure(tools="box_select")
p.scatter(
    x, y,
    radius=1,
    fill_alpha=0.6,
    line_color=None
)

div = Div(width=400)
button = Button(label="Button", width=300)
layout = column(button, row(p, div))

# Events with no attributes
button.js_on_event(
    events.ButtonClick,
    CustomJS(
        args=dict(div=div),
        code="""
div.text = "Button!";
"""))

p.js_on_event(
    events.SelectionGeometry,
    CustomJS(
        args=dict(div=div),
        code="""
div.text = "Selection! <p> <p>" + JSON.stringify(cb_obj.geometry, undefined, 2);
"""))

show(layout)
附加信息
可以将多种交互和事件连接到 CustomJS 回调。
- Widgets - Button, Toggle, Dropdown, TextInput, AutocompleteInput, Select, Multiselect, Slider, (DateRangeSlider), DatePicker,
- Tools - TapTool, BoxSelectTool, HoverTool,
- Selection - ColumnDataSource, AjaxDataSource, BlazeDataSource, ServerDataSource
- Ranges - Range1d, DataRange1d, FactorRange
有关更完整的示例,请参见《用户指南》中的 JavaScript交互 部分。
