Bokeh教程:演示布局
目录
本文翻译自 bokeh/bokeh-notebooks 项目,并经过修改。
在前面的章节中,我们已开始学习如何使用不同类型的数据创建单个绘图。 但是我们经常想要绘制不止一幅图。 Bokeh 绘图可以独立嵌入在 HTML 文档中,但使用 Bokeh 内置布局将多个绘图合并通常更容易。 我们将在本章节中学习如何实现。
载入 Bokeh。
from bokeh.io import output_notebook, show
from bokeh.plotting import figure

output_notebook()
下面定义我们将在示例中使用的一些数据变量。
x = list(range(11))
y0, y1, y2 = x, [10-i for i in x], [abs(i-5) for i in x]
行和列
bokeh.layouts 模块提供 row 和 column 函数用于将绘图安排在垂直和水平布局中。
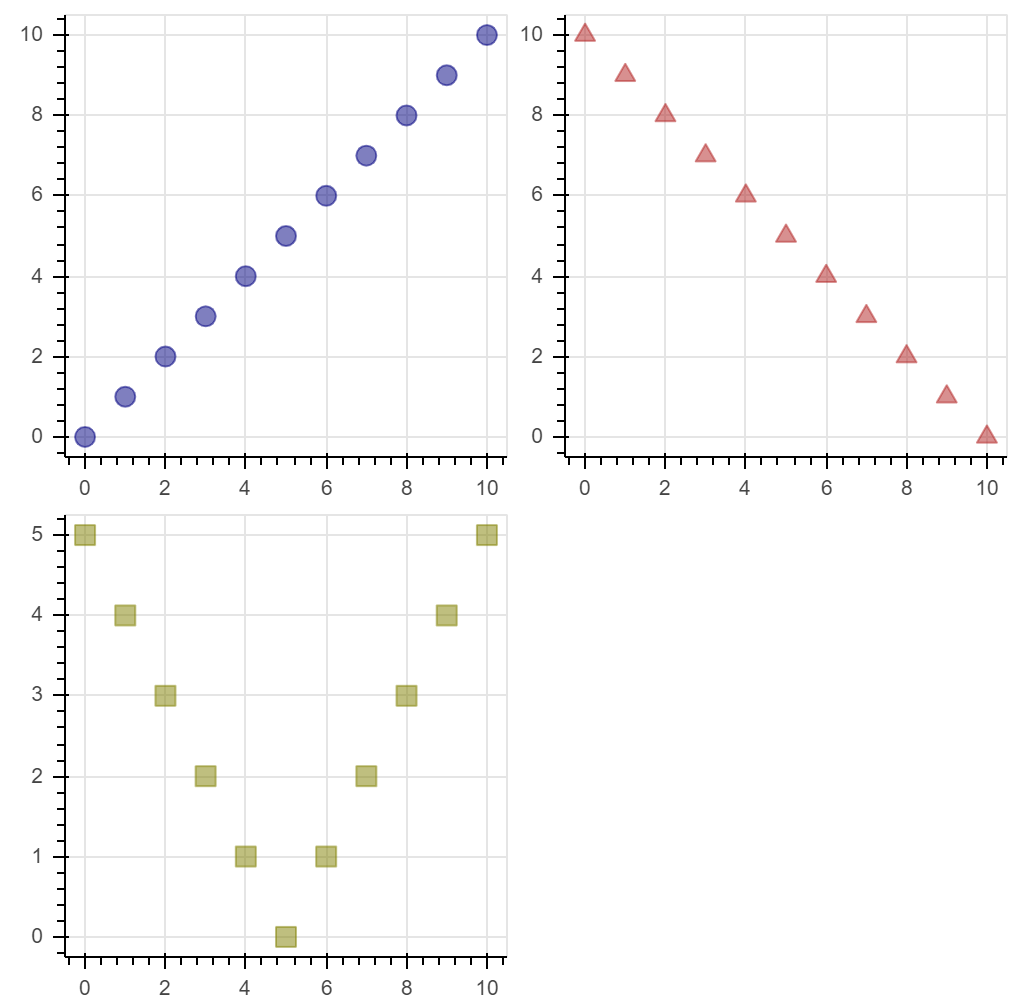
下面示例将三个绘图排列成一行。
from bokeh.layouts import row

# 创建一个新绘图
s1 = figure(
    width=250,
    plot_height=250,
)
s1.circle(
    x, y0,
    size=10,
    color="navy",
    alpha=0.5
)

# 创建另一个
s2 = figure(
    width=250,
    plot_height=250,
)
s2.triangle(
    x, y1,
    size=10,
    color="firebrick",
    alpha=0.5
)

# 再创建一个
s3 = figure(
    width=250,
    height=250
)
s3.square(
    x, y2,
    size=10,
    color="olive",
    alpha=0.5
)

# 将结果显示在一行
show(row(s1, s2, s3))
网格绘图
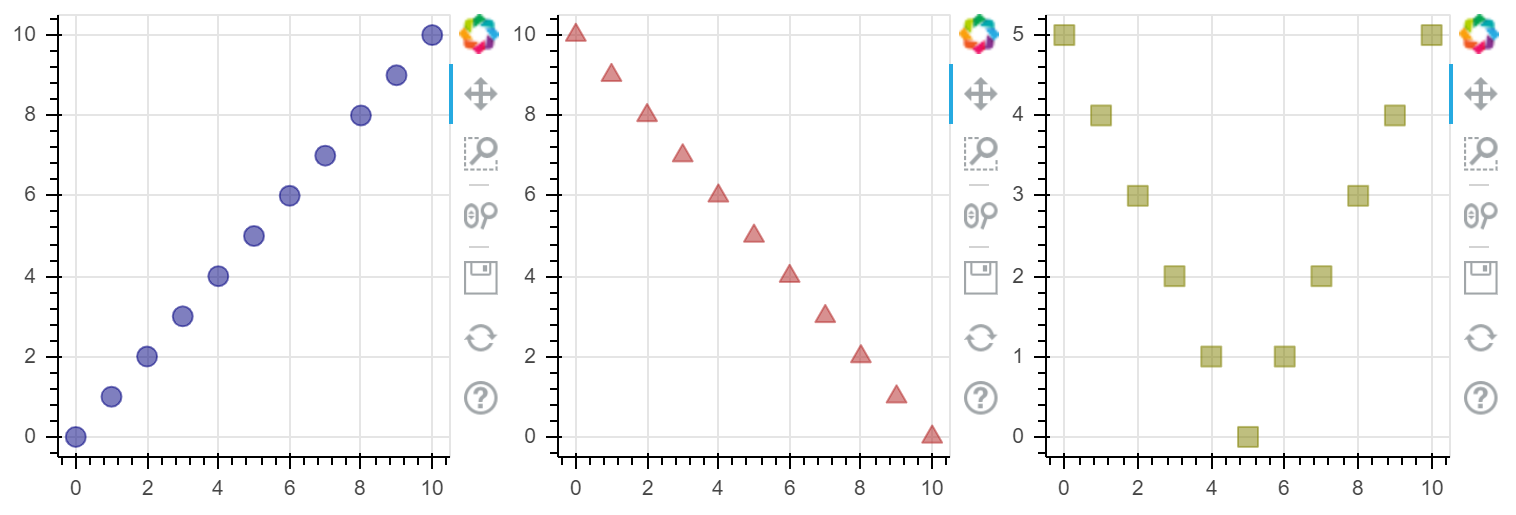
Bokeh 在 bokeh.layouts 中提供 gridplot 用于将绘图排列成网格。
下面是一个示例。
from bokeh.layouts import gridplot

# 创建一个新的绘图
s1 = figure(
    width=250,
    plot_height=250
)
s1.circle(
    x, y0,
    size=10,
    color="navy",
    alpha=0.5
)

# 创建另一个绘图
s2 = figure(
    width=250,
    height=250)
s2.triangle(
    x, y1,
    size=10,
    color="firebrick",
    alpha=0.5,
)

# 再创建一个绘图
s3 = figure(
    width=250,
    height=250
)
s3.square(
    x, y2,
    size=10,
    color="olive",
    alpha=0.5,
)

# 在 gridplot 中放置所有绘图
p = gridplot(
    [[s1, s2], [s3, None]],
    toolbar_location=None
)

# 显示绘图结果
show(p)